MACATAWA BANK CORPORATION
FORM 10-K ANNUAL REPORT
|
PART 1
|
Page
|
|
|
Item 1:
|
1 |
|
|
Item 1A:
|
12 |
|
|
Item 1B:
|
20 |
|
|
Item 2:
|
20 |
|
|
Item 3:
|
20 |
|
|
Item 4:
|
20 |
|
|
PART II
|
||
|
Item 5:
|
21 |
|
|
Item 6:
|
22 |
|
|
Item 7:
|
23 |
|
|
Item 7A:
|
40 |
|
|
Item 8:
|
42 |
|
| 42 | ||
|
Item 9:
|
85 | |
|
Item 9A:
|
85 | |
|
Item 9B:
|
87 | |
|
PART III
|
||
|
Item 10:
|
87 |
|
|
Item 11:
|
87 |
|
|
Item 12:
|
87 |
|
|
Item 13:
|
87 |
|
|
Item 14:
|
87 |
|
|
PART IV
|
||
|
Item 15:
|
88 | |
|
Item 16:
|
89 | |
| 90 |
Forward-Looking Statements
This report contains forward-looking statements that are based on management's beliefs, assumptions, current expectations, estimates and projections about the financial services industry, the
economy, and Macatawa Bank Corporation. Forward-looking statements are identifiable by words or phrases such as “outlook”, “plan” or “strategy”; that an event or trend “could”, “may”, “should”, “will”, “is likely”, or is “possible” or “probable”
to occur or “continue”, has “begun” or “is scheduled” or “on track” or that the Company or its management “anticipates”, “believes”, “estimates”, “plans”, “forecasts”, “intends”, “predicts”, “projects”, or “expects” a particular result, or is
“committed”, “confident”, “optimistic” or has an “opinion” that an event will occur, or other words or phrases such as “ongoing”, “future”, “signs”, “efforts”, “tend”, “exploring”, “appearing”, “until”, “near term”, “concern”, “going forward”,
“focus”, “starting”, “initiative,” “trend” and variations of such words and similar expressions. Such statements are based upon current beliefs and expectations and involve substantial risks and uncertainties which could cause actual results to
differ materially from those expressed or implied by such forward-looking statements. These statements include, among others, those related to the risks and uncertainties related to, and the impact of, the COVID-19 pandemic on the business,
financial conditions and results of operations of our company and our customers, future levels of earning assets, future composition of our loan portfolio, trends in credit quality metrics, future capital levels and capital needs, real estate
valuation, future levels of repossessed and foreclosed properties and nonperforming assets, future levels of losses and costs associated with the administration and disposition of repossessed and foreclosed properties and nonperforming assets,
future levels of loan charge-offs, future levels of other real estate owned, future levels of provisions for loan losses and reserve recoveries, the rate of asset dispositions, future dividends, future growth and funding sources, future cost of
funds, future liquidity levels, future profitability levels, future interest rate levels, future net interest margin levels, the effects on earnings of changes in interest rates, future economic conditions, future effects of new or changed
accounting standards, future loss recoveries, loan demand and loan growth, future amounts of unrecognized tax benefits and the future level of other revenue sources. Management's determination of the provision and allowance for loan losses, the
appropriate carrying value of intangible assets (including deferred tax assets) and other real estate owned, and the fair value of investment securities (including whether any impairment on any investment security is temporary or
other-than-temporary and the amount of any impairment) involves judgments that are inherently forward-looking. All statements with references to future time periods are forward-looking. All of the information concerning interest rate sensitivity
is forward-looking. Our ability to sell other real estate owned at its carrying value or at all, successfully implement new programs and initiatives, increase efficiencies, maintain our current levels of deposits and other sources of funding,
maintain liquidity, respond to declines in collateral values and credit quality, increase loan volume, originate high quality loans, maintain or improve mortgage banking income, realize the benefit of our deferred tax assets, continue payment of
dividends and improve profitability is not entirely within our control and is not assured. The future effect of changes in the real estate, financial and credit markets and the national and regional economy on the banking industry, generally, and
Macatawa Bank Corporation, specifically, are also inherently uncertain. These statements are not guarantees of future performance and involve certain risks, uncertainties and assumptions (“risk factors”) that are difficult to predict with regard
to timing, extent, likelihood and degree of occurrence. Therefore, actual results and outcomes may materially differ from what may be expressed or forecasted in such forward-looking statements. Macatawa Bank Corporation does not undertake to
update forward-looking statements to reflect the impact of circumstances or events that may arise after the date of the forward-looking statements.
Risk factors include, but are not limited to, the risk factors described in “Item 1A - Risk Factors” of this report. These and other factors are representative of the risk factors that may
emerge and could cause a difference between an ultimate actual outcome and preceding forward-looking statements.
| ITEM 1: |
Business.
|
As used in this report, the terms "we," "us," "our,” ”Macatawa” and “Company” mean Macatawa Bank Corporation and its subsidiaries, unless the context indicates another
meaning. The term "Bank" means Macatawa Bank.
Macatawa Bank Corporation is a Michigan corporation, incorporated in 1997, and is a registered bank holding company. It wholly owns Macatawa Bank, a Michigan chartered bank with depository
accounts insured by the FDIC. The Bank operates twenty-six branch offices and a lending and operational service facility, providing a full range of commercial and consumer banking and trust services in Kent County, Ottawa County, and northern
Allegan County, Michigan.
At December 31, 2021, we had total assets of $2.93 billion, total loans of $1.11 billion, total deposits of $2.58 billion and shareholders' equity of $254.0 million. We recognized net income
of $29.0 million in 2021 compared to net income of $30.2 million in 2020. As of December 31, 2021, the Company’s and the Bank’s risk-based regulatory capital ratios were significantly above those required under the regulatory standards and the
Bank continued to be categorized as “well capitalized” at December 31, 2021.
The Company paid a cash dividend of $0.08 per share for each quarter of 2020 and 2021.
In March 2020, guidance issued by the federal banking agencies in consultation with FASB staff and the Coronavirus Aid, Relief and Economic Security (“CARES”) Act collectively specified that
COVID-19 related modifications on loans that were not more than 30 days past due as of December 31, 2019 are not TDRs. Through December 31, 2021, the Bank had applied this guidance and modified 726 individual loans with aggregate principal
balances totaling $337.2 million. As of December 31, 2021, all of these modifications had expired and the loans had returned to their contractual payment terms.
The Bank was a participating lender in the Small Business Administration's (“SBA”) Paycheck Protection Program (“PPP”). PPP loans are forgivable, in whole or in part, if the proceeds are used
for payroll and other permitted purposes in accordance with the requirements of the PPP. These loans carry a fixed rate of 1.00% and a term of two years (loans made before June 5, 2020) or five years (loans made on or after June 5, 2020), if not
forgiven, in whole or in part. Payments are deferred until either the date on which the SBA remits the amount of forgiveness proceeds to the lender or the date that is 10 months after the last day of the covered period if the borrower does not
apply for forgiveness within that 10 month period. Fees generated based on the origination of PPP loans are deferred and amortized into interest income over the contractual period of 24 months or 60 months, as applicable. Upon SBA forgiveness,
unamortized fees are then recognized into interest income.
In 2020:
| • |
The Bank originated 1,738 PPP loans totaling $346.7 million in principal.
|
| • |
Fees generated totaled $10.0 million.
|
| • |
765 PPP loans totaling $113.5 million were forgiven.
|
| • |
Total net fees of $5.4 million were recognized.
|
In 2021:
| • |
The Bank originated 1,000 PPP loans totaling $128.1 million in principal.
|
| • |
Fees generated totaled $5.6 million.
|
| • |
1,722 PPP loans totaling $318.4 million were forgiven.
|
| • |
Total net fees of $8.3 million were recognized.
|
As of December 31, 2021, 240 PPP loans totaling $43.2 million in principal remained outstanding and total net fees of $1.3 million remained unrecognized.
We are in an asset-sensitive position, so decreases in short-term interest rates have a net negative impact on our net interest income as our interest-earning assets will reprice faster than
our interest-bearing liabilities; however, increases in short-term interest rates will have a net positive impact on net interest income. Given our asset-sensitivity, several years ago we established floors on our variable rate loans to help
offset the negative impact of declining interest rates on net interest income. These floors benefited net interest income in 2021 and 2020.
Over the past several years, our nonperforming asset levels have been low. The following table reflects period end balances of these nonperforming assets as well as total loan delinquencies.
|
December 31,
|
||||||||||||
|
(Dollars in thousands)
|
2021
|
2020
|
2019
|
|||||||||
|
Nonperforming loans
|
$
|
92
|
$
|
533
|
$
|
203
|
||||||
|
Other repossessed assets
|
—
|
—
|
—
|
|||||||||
|
Other real estate owned
|
2,343
|
2,537
|
2,748
|
|||||||||
|
Total nonperforming assets
|
$
|
2,435
|
$
|
3,070
|
$
|
2,951
|
||||||
|
Total delinquencies 30 days or greater past due
|
$
|
129
|
$
|
581
|
$
|
405
|
||||||
The following table reflects the provision for loan losses for the past three years along with certain metrics that impact the determination of the level of the provision for loan losses.
|
For the Year Ended December 31,
|
||||||||||||
|
(Dollars in thousands)
|
2021
|
2020
|
2019
|
|||||||||
|
Provision for loan losses
|
$
|
(2,050
|
)
|
$
|
3,000
|
$
|
(450
|
)
|
||||
|
Net charge-offs (recoveries)
|
(531
|
)
|
2,792
|
(774
|
)
|
|||||||
|
Net charge-offs (recoveries) to average loans
|
(0.04
|
)%
|
0.19
|
%
|
(0.06
|
)%
|
||||||
|
Nonperforming loans to total loans
|
0.01
|
%
|
0.04
|
%
|
0.01
|
%
|
||||||
|
Loans transferred to ORE to average loans
|
—
|
—
|
—
|
|||||||||
|
Performing troubled debt restructurings ("TDRs") to average
loans
|
0.60
|
%
|
0.60
|
%
|
0.99
|
%
|
||||||
We recorded a provision for loan losses benefit of $2.1 million in 2021. We recorded a provision for loan losses of $3.0 million in 2020 and we recorded a provision for loan losses benefit of
$450,000 in 2019. The level of provisions in each year was impacted by recoveries from our collection efforts and certain declines in our historical charge-off levels from prior years. The provision in 2020 was impacted by additional
qualitative factors applied for the COVID-19 pandemic and a large commercial loan charge-off.
We experienced net charge-offs in 2020 due to a $4.1 million charge-off on a single commercial loan relationship to a movie theatre business that was in process of liquidation at the time that
the COVID-19 pandemic began. Excluding that charge-off, we had net recoveries in 2020.
Economic conditions in our market areas of Grand Rapids and Holland, Michigan were good during the several years leading up to the COVID-19 pandemic and have generally recovered from the second
quarter 2020 low point caused by the pandemic and mitigation efforts. The state of Michigan’s unemployment rate at the end of 2021 was 5.9%. The Grand Rapids and Holland area unemployment rate was 3.6% at the end of 2021.
In the housing markets in our primary market areas strong purchase demand exists which has caused a shortage in the inventory of existing homes for sale. In response, new living unit starts
have increased. In the Grand Rapids market during 2021, total living unit starts were up 19% compared to 2020. The Holland-Grand Haven/Lakeshore region showed even better results with living units starts up 27% over 2020. Generally speaking,
residential housing property values have significantly increased during the pandemic.
Commercial banking is an important focus for us. Most of our emphasis has been on growing commercial and industrial loans. The PPP program and borrowers' reluctance to deploy funds during the
pandemic has had a significant impact on commercial lending over the past two years. Our commercial and industrial loans have decreased from $499.6 million at December 31, 2019 to $420.3 million at December 31, 2021. Commercial real estate
loans have decreased from $598.5 million at December 31, 2019 to $516.1 million at December 31, 2021. Consumer loans have decreased from $287.6 million at December 31, 2019 to $172.6 million at December 31, 2021. We believe we are positioned
for loan growth in 2022.
We have no material foreign loans, assets or activities. No material part of our business is dependent on a single customer or very few customers. Our loan portfolio is not concentrated in any
one industry.
Our internet website address is www.macatawabank.com. We make available free of charge through this website our annual report on Form 10-K, our quarterly reports on Form 10-Q and our current
reports on Form 8-K and amendments to those reports as soon as reasonably practicable after filing or furnishing such reports with the Securities and Exchange Commission. The information on our website address is not incorporated by reference
into this report, and the information on the website is not part of this report.
Products and Services
Loan Portfolio
We have historically offered a broad range of loan products to business customers, including commercial and industrial and commercial real estate loans, and to retail customers, including
residential mortgage and consumer loans. Select, well-managed loan renewal activity is taking place and we are seeing growth in our commercial loan portfolios and pipelines. Following is a discussion of our various types of lending activities.
Commercial and Industrial Loans
Our commercial and industrial lending portfolio contains loans with a variety of purposes and security, including loans to finance operations and equipment. Generally, our commercial and
industrial lending has been limited to borrowers headquartered, or doing business, in our primary market area. These credit relationships typically require the satisfaction of appropriate loan covenants and debt formulas, and generally require
that the Bank be the primary depository bank of the business. These loan covenants and debt formulas are monitored through periodic, required reporting of accounts receivable aging schedules and financial statements, and in the case of larger
business operations, reviews or audits by independent professional firms.
Commercial and industrial loans typically are made on the basis of the borrower's ability to make repayment from the cash flow of the borrower's business. As a result, the availability of
funds for the repayment of commercial business loans may be substantially dependent on the success of the business itself and economic conditions. Further, the collateral securing the loans may depreciate over time, may be difficult to appraise
and may fluctuate in value based on the success of the business.
Commercial Real Estate Loans
Our commercial real estate loans consist primarily of construction and development loans and multi-family and other non-residential real estate loans.
Construction and Development Loans. These consist of construction loans to commercial customers for the construction of their business facilities. They also include construction loans to builders and developers for the construction of one- to four-family residences
and the development of one- to four-family lots, residential subdivisions, condominium developments and other commercial developments.
This portfolio can be affected by job losses, declines in real estate value, declines in home sale volumes, and declines in new home building. As such, we limit our exposure to residential
land development and other construction and development loans.
Multi-Family and Other Non-Residential Real Estate Loans. These are permanent loans secured by multi-family and other non-residential real estate and include loans secured by apartment buildings, condominiums, small office buildings, small business
facilities, medical facilities and other non-residential building properties, substantially all of which are located within our primary market area.
Multi-family and other non-residential real estate loans generally present a higher level of risk than loans secured by owner occupied one- to four-family residences. This greater risk is due
to several factors, including the concentration of principal in a limited number of loans and borrowers, the effects of general economic conditions on income producing properties and the increased difficulty of evaluating and monitoring these
types of loans. Furthermore, the repayment of these loans is typically dependent upon the successful operation of the related real estate project. For example, if leases are not obtained or renewed, or a bankruptcy court modifies a lease term,
or a major tenant is unable to fulfill its lease obligations, cash flow from the project will be reduced. If cash flow from the project is reduced, the borrower's ability to repay the loan may be impaired.
Retail Loans
Our retail loans are loans to consumers and consist primarily of residential mortgage loans and consumer loans.
Residential Mortgage Loans. We
originate construction loans to individuals for the construction of their residences and owner-occupied residential mortgage loans, which are generally long-term with either fixed or adjustable interest rates. Our general policy is to sell the
majority of our fixed rate residential mortgage loans in the secondary market due primarily to the interest rate risk associated with these loans. For 2021, we retained loans representing 22% of the total dollar volume originated, compared to
18% in 2020.
Our borrowers generally qualify and are underwritten using industry standards for quality residential mortgage loans. We do not originate loans that are considered "sub-prime". Residential
mortgage loan originations derive from a number of sources, including advertising, direct solicitation, real estate broker referrals, existing borrowers and depositors, builders and walk-in customers. Loan applications are accepted at most of
our offices and online. The substantial majority of these loans are secured by one-to-four family properties in our market area.
Consumer Loans. We originate a
variety of different types of consumer loans, including automobile loans, home equity lines of credit and installment loans, home improvement loans, deposit account loans and other loans for household and personal purposes. We also originate
home equity lines of credit utilizing the same underwriting standards as for home equity installment loans. Home equity lines of credit are revolving line of credit loans. The majority of our existing home equity line of credit portfolio has
variable rates with floors and ceilings, interest only payments and a maximum maturity of ten years.
The underwriting standards that we employ for consumer loans include a determination of the applicant's payment history on other debts and ability to meet existing obligations and payments on
the proposed loan. Although creditworthiness of the applicant is of primary consideration, the underwriting process also includes a comparison of the value of the security, if any, in relation to the proposed loan amount. Consumer loans may
entail greater credit risk than do residential mortgage loans, particularly in the case of consumer loans which are unsecured or are secured by rapidly depreciable assets, such as automobiles. In such cases, any repossessed collateral for a
defaulted consumer loan may not provide an adequate source of repayment of the outstanding loan balance as a result of the greater likelihood of damage, loss or depreciation. In addition, consumer loan collections are dependent on the borrower's
continuing financial stability, and are more likely to be affected by adverse personal circumstances. Furthermore, the application of various federal and state laws, including bankruptcy and insolvency laws, may limit the amount which can be
recovered on such loans.
Loan Portfolio Composition
The following table reflects the composition of our loan portfolio and the corresponding percentage of our total loans represented by each class of loans as of the dates indicated.
|
December 31
|
||||||||||||||||
|
2021
|
2020
|
|||||||||||||||
|
(Dollars in thousands)
|
Amount
|
% of
Total
Loans
|
Amount
|
% of
Total
Loans
|
||||||||||||
|
Real estate - construction (1)
|
$
|
52,019
|
4
|
%
|
$
|
64,171
|
4
|
%
|
||||||||
|
Real estate - mortgage
|
464,082
|
42
|
488,002
|
34
|
||||||||||||
|
Comml and industrial, excl PPP
|
378,318
|
34
|
436,331
|
31
|
||||||||||||
|
PPP loans
|
41,939
|
4
|
229,079
|
16
|
||||||||||||
|
Total commercial
|
936,358
|
84
|
1,217,583
|
85
|
||||||||||||
|
Residential mortgage
|
117,800
|
11
|
149,556
|
11
|
||||||||||||
|
Consumer
|
54,835
|
5
|
62,192
|
4
|
||||||||||||
|
Total loans
|
1,108,993
|
100
|
%
|
1,429,331
|
100
|
%
|
||||||||||
|
Less: allowance for loan losses
|
(15,889
|
)
|
(17,408
|
)
|
||||||||||||
|
Total loans, net
|
$
|
1,093,104
|
$
|
1,411,923
|
||||||||||||
| (1) |
Consists of construction and development loans.
|
At December 31, 2021, there was no concentration of loans exceeding 10% of total loans which were not otherwise disclosed as a category of loans in the table above.
Maturities and Sensitivities of Loans to Changes in Interest Rates
The following table shows the amount of total loans outstanding at December 31, 2021 which, based on maturity dates, are due in the periods indicated.
|
Maturing
|
||||||||||||||||||||
|
(Dollars in thousands)
|
Within One
Year
|
After One, But
Within Five
Years
|
After Five, But
Within Fifteen
Years
|
After Fifteen
Years
|
Total
|
|||||||||||||||
|
Real estate - construction (1)
|
$
|
22,109
|
$
|
15,368
|
$
|
14,542
|
$
|
—
|
$
|
52,019
|
||||||||||
|
Real estate - mortgage
|
53,461
|
258,746
|
151,875
|
—
|
464,082
|
|||||||||||||||
|
Commercial and industrial (2)
|
175,756
|
213,471
|
31,030
|
—
|
420,257
|
|||||||||||||||
|
Total commercial
|
251,326
|
487,585
|
197,447
|
—
|
936,358
|
|||||||||||||||
|
Residential mortgage
|
314
|
4,088
|
55,795
|
57,603
|
117,800
|
|||||||||||||||
|
Consumer
|
2,010
|
7,997
|
4,718
|
40,110
|
54,835
|
|||||||||||||||
|
Total loans
|
$
|
253,650
|
$
|
499,670
|
$
|
257,960
|
$
|
97,713
|
$
|
1,108,993
|
||||||||||
|
Predetermined
Interest Rates
|
Floating or
Variable Rate
|
Total
|
||||||||||
|
Loans above maturing after one year:
|
||||||||||||
|
Real estate - construction (1)
|
$
|
7,767
|
$
|
22,144
|
$
|
29,911
|
||||||
|
Real estate - mortgage
|
314,555
|
96,065
|
410,620
|
|||||||||
|
Commercial and industrial (2)
|
188,446
|
56,055
|
244,501
|
|||||||||
|
Total commercial
|
510,768
|
174,264
|
685,032
|
|||||||||
|
Residential mortgage
|
65,158
|
52,329
|
117,487
|
|||||||||
|
Consumer
|
8,191
|
44,633
|
52,824
|
|||||||||
|
Total loans
|
$
|
584,117
|
$
|
271,226
|
$
|
855,343
|
||||||
| (1) |
Consists of construction and development loans.
|
| (2) |
Includes $41.9 million of PPP loans.
|
Loan Loss Experience
A summary of our loan balances at the end of 2021 and 2020 and the daily average balances of these loans as well as changes in the allowance for loan losses arising from loans charged-off and
recoveries on loans previously charged-off, and additions to the allowance which we have expensed is shown in Item 7 of this report under the headings "Portfolio Loans and Asset Quality" and “Allowance for Loan Losses” included in "Management's
Discussion and Analysis of Results of Operations and Financial Condition."
Additional information about our allowance for loan losses, including a table showing the allocation of the allowance for loan losses at the end of 2021 and 2020 and the factors which
influenced management’s judgment in determining the amount of the additions to the allowance charged to operating expense, may be found in Item 7 of this report under the heading "Allowance for Loan Losses" in "Management's Discussion and
Analysis of Results of Operations and Financial Condition."
Deposit Portfolio
We offer a broad range of deposit services, including checking accounts, savings accounts and time deposits of various types. Transaction accounts and savings and time certificates are
tailored to the principal market area at rates competitive with those offered in the area. All deposit accounts are insured by the FDIC up to the maximum amount permitted by law.
We solicit deposit services from individuals, businesses, associations, churches, nonprofit organizations, financial institutions and government authorities. Deposits are gathered primarily
from the communities we serve through our network of 26 branches. We offer business and consumer checking accounts, regular and money market savings accounts, and certificates of deposit with many term options. We operate in a competitive
environment, competing with other local banks similar in size and with significantly larger regional banks. We monitor rates at other financial institutions in the area to ascertain that our rates are competitive with the market. We also attempt
to offer a wide variety of products to meet the needs of our customers. We set our deposit pricing to be competitive with other banks in our market area.
We may utilize alternative funding sources as needed, including short-term borrowings, advances from the Federal Home Loan Bank of Indianapolis or the Federal Reserve Bank of Chicago,
securities sold under agreements to repurchase ("repo borrowings") and brokered deposits. We had no brokered deposits or repo borrowings at December 31, 2021 or 2020.
Deposit Portfolio Composition
The following table sets forth the average deposit balances and the weighted average rates paid.
|
December 31
|
||||||||||||||||
|
2021
|
2020
|
|||||||||||||||
|
(Dollars in thousands)
|
Average
Amount
|
Average
Rate
|
Average
Amount
|
Average
Rate
|
||||||||||||
|
Noninterest bearing demand
|
$
|
885,838
|
—
|
%
|
$
|
659,387
|
—
|
%
|
||||||||
|
Interest bearing demand
|
681,411
|
0.03
|
535,922
|
0.1
|
||||||||||||
|
Savings and money market accounts
|
822,235
|
0.03
|
715,135
|
0.2
|
||||||||||||
|
Time
|
101,353
|
0.49
|
134,199
|
1.5
|
||||||||||||
|
Total deposits
|
$
|
2,490,837
|
0.06
|
%
|
$
|
2,044,643
|
0.3
|
%
|
||||||||
The following table summarizes deposits exceeding the FDIC insured limit of $250,000 by time remaining until maturity (dollars in thousands).
|
Non-maturity
deposits
|
Time
|
Total
|
||||||||||
|
December 31, 2021
|
||||||||||||
|
Three months or less
|
$
|
1,167,790
|
$
|
5,706
|
$
|
1,173,496
|
||||||
|
Over 3 months through 6 months
|
—
|
7,310
|
7,310
|
|||||||||
|
Over 6 months through 1 year
|
—
|
8,747
|
8,747
|
|||||||||
|
Over 1 year
|
—
|
6,465
|
6,465
|
|||||||||
|
$
|
1,167,790
|
$
|
28,228
|
$
|
1,196,018
|
|||||||
|
Non-maturity
deposits
|
Time
|
Total
|
||||||||||
|
December 31, 2020
|
||||||||||||
|
Three months or less
|
$
|
1,006,793
|
$
|
5,293
|
$
|
1,012,086
|
||||||
|
Over 3 months through 6 months
|
—
|
7,899
|
7,899
|
|||||||||
|
Over 6 months through 1 year
|
—
|
8,345
|
8,345
|
|||||||||
|
Over 1 year
|
—
|
7,214
|
7,214
|
|||||||||
|
$
|
1,006,793
|
$
|
28,751
|
$
|
1,035,544
|
|||||||
As of the date of this report, the Bank had no material foreign deposits.
Securities Portfolio
Our securities portfolio is classified as either "available for sale" or "held to maturity." Securities classified as "available for sale" may be sold prior to maturity due to changes in
interest rates, prepayment risks, and availability of alternative investments, or to meet our liquidity needs.
The primary objective of our investing activities is to provide for the safety of the principal invested. Our secondary considerations include the maximization of earnings, liquidity and to
help decrease our overall exposure to changes in interest rates. We have generally invested in bonds with lower credit risk, primarily those secured by government agencies or insured municipalities, to assist in the diversification of credit
risk within our asset base. The commercial bond component of this category decreased by $2.9 million in 2021.
These bonds represent financing provided to some of our non-profit commercial customers who qualified for borrowing on a tax-exempt basis. We have not experienced any credit losses within our
securities portfolio.
The following table reflects the composition of our securities portfolio as of the dates indicated (including securities available for sale and held to maturity).
|
December 31,
|
||||||||
|
(Dollars in thousands)
|
2021
|
2020
|
||||||
|
U.S. Treasury and federal agency securities
|
$
|
206,845
|
$
|
64,110
|
||||
|
U.S. Agency MBS and CMOs
|
86,797
|
64,983
|
||||||
|
Tax-exempt state and municipal bonds
|
174,559
|
125,110
|
||||||
|
Taxable state and municipal bonds
|
79,561
|
57,177
|
||||||
|
Corporate bonds
|
5,304
|
4,920
|
||||||
|
Total
|
$
|
553,066
|
$
|
316,300
|
||||
At December 31, 2021, other than our holdings in U.S. Treasury and U.S. Government Agency Securities, we had no investments in securities of any one issuer with an aggregate book value in
excess of 10% of shareholders' equity. At December 31, 2021, we had two investments totaling $911,000 in securities of issuers outside of the United States.
Schedule of Maturities of Investment Securities and Weighted Average Yields
The following is a schedule of investment securities maturities and their weighted average yield by category at December 31, 2021.
|
Due Within One Year
|
One to Five Years
|
Five to Ten Years
|
After Ten Years
|
|||||||||||||||||||||||||||||
|
(Dollars in thousands)
|
Amount
|
Average
Yield
|
Amount
|
Average
Yield
|
Amount
|
Average
Yield
|
Amount
|
Average
Yield
|
||||||||||||||||||||||||
|
U.S. Treasury and federal
agency securities
|
$
|
4,631
|
1.88
|
%
|
$
|
134,259
|
1.13
|
%
|
$
|
67,955
|
1.17
|
%
|
$
|
—
|
—
|
%
|
||||||||||||||||
|
U.S. Agency MBS and
CMOs
|
—
|
—
|
267
|
3.04
|
1,781
|
2.11
|
84,748
|
1.65
|
||||||||||||||||||||||||
|
Tax-exempt state and
municipal bonds (1)
|
32,144
|
1.46
|
95,398
|
1.71
|
30,123
|
2.74
|
16,895
|
2.96
|
||||||||||||||||||||||||
|
Taxable state and municipal
bonds
|
12,337
|
2.41
|
38,560
|
1.97
|
28,664
|
1.40
|
—
|
—
|
||||||||||||||||||||||||
|
Corporate bonds
|
912
|
3.36
|
4,392
|
1.35
|
—
|
—
|
—
|
—
|
||||||||||||||||||||||||
|
Total (1)
|
$
|
50,024
|
1.76
|
%
|
$
|
272,876
|
1.47
|
%
|
$
|
128,523
|
1.59
|
%
|
$
|
101,643
|
1.87
|
%
|
||||||||||||||||
| (1) |
Yields on tax-exempt securities are computed on a fully taxable-equivalent basis and calculated on a weighted average basis using the investment balances and respective average yields for each investment
category.
|
Trust Services
We offer trust services to further provide for the financial needs of our customers. As of December 31, 2021, the Trust Department managed assets of approximately $1.201 billion. Our types of
service include both personal trust and retirement plan services.
Our personal trust services include financial planning, investment management services, trust and estate administration and custodial services. As of December 31, 2021, personal trust assets
under management totaled approximately $620.9 million. Our retirement plan services encompass all types of qualified retirement plans, including profit sharing, 401(k) and pension plans. As of December 31, 2021, retirement plan assets under
management totaled approximately $580.4 million.
Market Area
Our primary market area includes Ottawa, Kent and northern Allegan Counties, all located in western Michigan. This area includes two mid-sized cities, Grand Rapids and Holland, and rural areas.
Grand Rapids is the second largest city in Michigan. Holland is the largest city in Ottawa County. Both cities and surrounding areas have a solid and diverse economic base, which includes health and life sciences, tourism, office and home
furniture, automotive components and assemblies, pharmaceutical, transportation, equipment, food and construction supplies. Grand Valley State University, a 25,000-student regional university with nearly 2,000 employees, has its three main
campuses in our market area. GVSU and several smaller colleges and university affiliates located in our market area help stabilize the local economy because they are not as sensitive to the fluctuations of the broader economy. Companies
operating in the market area include the Van Andel Institute, Steelcase, Herman Miller, Amway, Gentex, Spectrum Health, Haworth, Wolverine World Wide, Johnson Controls, General Motors, Gerber, Magna, SpartanNash and Meijer.
Competition
There are many bank, thrift, credit union and other financial institution offices located within our market area. Most are branches of larger financial institutions. We also face competition
from finance companies, insurance companies, mortgage companies, securities brokerage firms, money market funds and other providers of financial services. Many of our competitors have been in business a number of years, have established customer
bases, are larger and have higher lending limits than we do. We compete for loans, deposits and other financial services based on our ability to communicate effectively with our customers, to understand and meet their needs and to provide high
quality customer service. Our management believes that our personal service philosophy, our local decision-making and diverse delivery channels enhances our ability to compete favorably in attracting individuals and small businesses. We
actively solicit customers by offering our customers personal attention, professional service, and competitive interest rates.
Employees
As of December 31, 2021, we had 311 full-time equivalent employees consisting of 279 full-time and 51 part-time employees. We have assembled a staff of experienced, dedicated and qualified
professionals whose goal is to meet the financial needs of our customers while providing outstanding service. The majority of our management team has at least 10 years of banking experience, and several key personnel have more than 20 years of
banking experience. None of our employees are represented by collective bargaining agreements with us.
SUPERVISION AND REGULATION
The following is a summary of statutes and regulations affecting Macatawa Bank Corporation and Macatawa Bank. A change in applicable laws or regulations may have a material
effect on us and our business.
The information under Item 1 – Business of this report is incorporated here by reference.
General
Financial institutions and their holding companies are extensively regulated under federal and state law. Consequently, our growth and earnings performance can be affected not only by
management decisions and general economic conditions, but also by the statutes administered by, and the regulations and policies of, various governmental regulatory authorities. Those authorities include, but are not limited to, the Board of
Governors of the Federal Reserve System (the "Federal Reserve Board"), the FDIC, the State of Michigan’s Department of Insurance and Financial Services (“DIFS”), the Internal Revenue Service, and state taxing authorities. The effect of such
statutes, regulations and policies can be significant, and cannot be predicted with a high degree of certainty.
Federal and state laws and regulations generally applicable to financial institutions and their holding companies regulate, among other things, the scope of business, investments, reserves
against deposits, capital levels relative to operations, lending activities and practices, the nature and amount of collateral for loans, the establishment of branches, mergers, consolidations and declaration and payment of dividends. The system
of supervision and regulation applicable to us and our bank establishes a comprehensive framework for our respective operations and is intended primarily for the protection of the FDIC's deposit insurance fund, our depositors, and the public,
rather than our shareholders.
Federal law and regulations establish supervisory standards applicable to our lending activities, including internal controls, credit underwriting, loan documentation and loan-to-value ratios
for loans secured by real property.
Macatawa Bank Corporation
General.
Macatawa Bank Corporation is registered as a bank holding company with, and subject to regulation by, the Federal Reserve Board under the Bank Holding Company Act of 1956, as amended (the "BHCA"). Under the BHCA, Macatawa Bank Corporation is
subject to periodic examination by the Federal Reserve Board, and is required to file with the Federal Reserve Board periodic reports of our operations and such additional information as the Federal Reserve Board may require.
In accordance with Federal Reserve Board policy, Macatawa Bank Corporation is expected to act as a source of financial strength to the Bank and to commit resources to support the Bank. In
addition, if the DIFS deems the Bank's capital to be impaired, the DIFS may require the Bank to restore its capital by a special assessment upon Macatawa Bank Corporation as the Bank's sole shareholder. If Macatawa Bank Corporation were to fail
to pay any such assessment, the directors of the Bank would be required, under Michigan law, to sell all or part of the shares of the Bank's stock owned by Macatawa Bank Corporation to the highest bidder at either a public or private auction and
use the proceeds of the sale to restore the Bank's capital.
Investments and Activities. In general, any direct or indirect acquisition by us of any voting shares of any bank which would result in our direct or indirect ownership or control of more than 5% of any class of voting shares of such bank, and any merger
or consolidation between us and another bank holding company or financial holding company, will require the prior written approval of the Federal Reserve Board under the BHCA.
The merger or consolidation of the Bank with another bank, or the acquisition by the Bank of assets of another bank, or the assumption of liability by the Bank to pay any deposits of another
bank, will require the prior written approval of the FDIC under the Bank Merger Act and DIFS under the Michigan Banking Code. In addition, in certain such cases, an application to, and the prior approval of, the Federal Reserve Board under the
BHCA may be required.
Capital Requirements. The Federal Reserve Board uses capital adequacy guidelines in its examination and regulation of bank holding companies. If capital falls below minimum guidelines, a bank holding company may, among other things, be denied approval
to acquire or establish additional banks or non-bank businesses.
Additional information on our capital ratios may be found in Item 7 of this report under the heading "Capital Resources" included in "Management’s Discussion and Analysis of Results of
Operations and Financial Condition" and in Item 8 of this report in the Notes to the Consolidated Financial Statements, and is here incorporated by reference.
Dividends.
Macatawa Bank Corporation is a corporation separate and distinct from the Bank. Most of our revenues are dividends paid by the Bank. Thus, Macatawa Bank Corporation's ability to pay dividends to our shareholders is indirectly limited by
restrictions on the Bank's ability to pay dividends described below. Further, in a policy statement, the Federal Reserve Board has expressed its view that a bank holding company should not pay cash dividends if its net income available to
shareholders for the past four quarters, net of dividends paid during that period, is not sufficient to fully fund the dividends, its prospective rate of earnings retention is not consistent with capital needs and overall current and
prospective financial condition, or it will not meet, or is in danger of not meeting, its minimum regulatory capital adequacy ratios. The Federal Reserve Board possesses enforcement powers over bank holding companies and their non-bank
subsidiaries to prevent or remedy actions that represent unsafe or unsound practices or violations of applicable statutes and regulations. Among these powers is the ability to proscribe the payment of dividends by banks and bank holding
companies. Similar enforcement powers over our Bank are possessed by the FDIC. The "prompt corrective action" provisions of federal law and regulation authorizes the FDIC to restrict the payment of dividends to Macatawa Bank Corporation by
our Bank if the Bank fails to meet specified capital levels.
In addition, the Michigan Business Corporation Act provides that dividends may be legally declared or paid only if after the distribution a corporation can pay its debts as they come due in the
usual course of business and its total assets equal or exceed the sum of its liabilities plus the amount that would be needed to satisfy the preferential rights upon dissolution of any holders of preferred stock whose preferential rights are
superior to those receiving the distribution.
Additional information about restrictions on the payment of dividends by the Bank may be found in Item 8 of this report in Notes 1 and 19 to the Consolidated Financial Statements and is here
incorporated by reference.
Federal Securities Regulation. Our common stock is registered under the Securities Exchange Act of 1934, as amended (the "Exchange Act"). We are subject to the information, proxy solicitation, insider trading and other restrictions and requirements of
the SEC under the Exchange Act. We are subject to the Sarbanes-Oxley Act, which imposes numerous reporting, accounting, corporate governance and business practices on companies, as well as financial and other professionals who have involvement
with the U.S. public markets. We are generally subject to these requirements and applicable SEC rules and regulations.
Macatawa Bank
General.
Macatawa Bank is a Michigan banking corporation, and its deposit accounts are insured by the Deposit Insurance Fund (the "Insurance Fund") of the FDIC. The Bank is subject to the examination, supervision, reporting and enforcement requirements
of the DIFS, as the chartering authority for Michigan banks, and the FDIC, as administrator of the Insurance Fund. These agencies, and the federal and state laws applicable to the Bank and its operations, extensively regulate various aspects
of the banking business, including, among other things, permissible types and amounts of loans, investments and other activities, capital adequacy, branching, interest rates on loans and on deposits, the maintenance of noninterest bearing
reserves on deposit accounts, and the safety and soundness of banking practices.
Deposit Insurance. As an FDIC-insured institution, the Bank is required to pay deposit insurance premium assessments to the FDIC. The FDIC has adopted a risk-based assessment system under which all insured depository institutions are placed into one
of four categories and assessed insurance premiums, based upon their respective levels of capital and results of supervisory evaluation. Institutions categorized as well-capitalized (as defined by the FDIC) and considered healthy pay the
lowest premium, while institutions that are categorized as less than adequately capitalized (as defined by the FDIC) and considered of substantial supervisory concern pay the highest premium. Risk classification of all insured institutions is
made by the FDIC for each semi-annual assessment period.
The FDIC’s deposit insurance assessment base methodology uses average consolidated total assets less average tangible equity as the assessment base. Under this calculation, most well
capitalized banks will pay 5 to 9 basis points annually, increasing up to 35 basis points for banks that pose significant supervisory concerns. This base rate may be adjusted for the level of unsecured debt and brokered deposits, resulting in
adjusted rates ranging from 2.5 to 9 basis points annually for most well capitalized banks to 30 to 45 basis points for banks that pose significant supervisory concerns. We estimate our annual assessment rate to be 3 basis points in 2022.
Capital Requirements. The FDIC has established the following minimum capital standards for FDIC insured banks that are not relying on the Community Bank Leverage Ratio, such as the Bank: a leverage requirement consisting of a ratio of Tier 1 capital to
total average assets and risk-based capital requirements consisting of a ratio of total capital to total risk-weighted assets, a ratio of Tier 1 capital to total risk-weighted assets, and a ratio of common equity Tier 1 (CET1) capital to risk
weighted assets. Tier 1 capital consists principally of shareholders' equity. Common equity Tier 1 capital excludes forms of stock that are not common stock.
Basel III. In July 2013, the Board of Governors of the Federal Reserve Board and the FDIC approved the rules implementing the Basel Committee on Banking Supervision's capital guidelines for U.S.
banks (commonly known as Basel III). The rules include a common equity Tier 1 capital to risk-weighted assets ratio (CET1 ratio) of 4.5% and a capital conservation buffer of 2.5% of risk-weighted assets, which effectively results in a minimum
CET1 ratio of 7.0%. The minimum ratio of Tier 1 capital to risk-weighted assets is 6.0% (which effectively results in a minimum Tier 1 capital ratio of 8.5%), which effectively results in a minimum total capital to risk-weighted assets ratio of
10.5% (with the capital conservation buffer), and requires a minimum leverage ratio of 4.0%. The capital ratios for the Company and the Bank under Basel III continue to exceed the well capitalized minimum capital requirements.
Federal regulations define these capital categories as follows:
|
CET1 Risk-Based
Capital Ratio
|
Tier 1 Risk-Based
Capital Ratio
|
Total Risk-Based
Capital Ratio
|
Leverage Ratio
|
|||||
|
Well capitalized
|
6.5% or above
|
8% or above
|
10% or above
|
5% or above
|
||||
|
Adequately capitalized
|
4.5% or above
|
6% or above
|
8% or above
|
4% or above
|
||||
|
Undercapitalized
|
Less than 4.5%
|
Less than 6%
|
Less than 8%
|
Less than 4%
|
||||
|
Significantly undercapitalized
|
Less than 3%
|
Less than 4%
|
Less than 6%
|
Less than 3%
|
||||
|
Critically undercapitalized
|
—
|
—
|
—
|
Ratio of tangible equity to total assets of 2% or less
|
Federal law provides the federal banking regulators with broad power to take prompt corrective action to resolve the problems of undercapitalized institutions. Depending upon the capital
category to which an institution is assigned, the regulators' corrective powers include: requiring the submission of a capital restoration plan; placing limits on asset growth and restrictions on activities; requiring the institution to issue
additional capital stock (including additional voting stock) or to be acquired; restricting transactions with affiliates; restricting the interest rate the institution may pay on deposits; ordering a new election of directors of the institution;
requiring that senior executive officers or directors be dismissed; prohibiting the institution from accepting deposits from correspondent banks; requiring the institution to divest certain subsidiaries; prohibiting the payment of principal or
interest on subordinated debt; and ultimately, appointing a receiver for the institution.
In general, a depository institution may be reclassified to a lower category than is indicated by its capital levels if the appropriate federal depository institution regulatory agency
determines the institution to be otherwise in an unsafe or unsound condition or to be engaged in an unsafe or unsound practice. This could include a failure by the institution, following receipt of a less-than-satisfactory rating on its most
recent examination report, to correct the deficiency.
As of December 31, 2021, the Bank was categorized as “well capitalized” under the standards set forth in the rules implementing Basel III. Additional information on our capital ratios may be
found in Item 8 of this report in the Notes to the Consolidated Financial Statements, and is here incorporated by reference.
Dividends.
Under Michigan law, the Bank is restricted as to the maximum amount of dividends it may pay on its common stock. The Bank may not pay dividends except out of net income after deducting its losses and bad debts. A Michigan state bank may not
declare or pay a dividend unless the bank will have surplus amounting to at least 20% of its capital after the payment of the dividend.
Federal law generally prohibits a depository institution from making any capital distribution (including payment of a dividend) or paying any management fee to its holding company if the
depository institution would thereafter be undercapitalized. The FDIC may prevent an insured bank from paying dividends if the bank is in default of payment of any assessment due to the FDIC. In addition, the FDIC may prohibit the payment of
dividends by the Bank, if such payment is determined to be an unsafe and unsound banking practice.
Additional information about restrictions on payment of dividends by the Bank may be found in Item 8 of this report in Notes 1 and 19 to the Consolidated Financial Statements, and is here
incorporated by reference.
Insider Transactions. The Bank is subject to certain restrictions imposed by federal law on any extensions of credit to Macatawa or any subsidiary of Macatawa, on investments in the stock or other securities of Macatawa or any subsidiary of Macatawa and
the acceptance of the stock or other securities of Macatawa or any subsidiary of Macatawa as collateral for loans. Certain limitations and reporting requirements are also placed on extensions of credit by the Bank to its directors and
officers, to Macatawa's directors and officers, to our principal shareholders and to "related interests" of such directors, officers and principal shareholders. In addition, federal law and regulations may affect the terms upon which any
person becoming a director or officer of our company or any subsidiary or a principal shareholder in our company may obtain credit from banks with which the Bank maintains a correspondent relationship.
Safety and Soundness Standards. The federal banking agencies have adopted guidelines to promote the safety and soundness of federally insured depository institutions. These guidelines establish standards for, among other things, internal controls,
information systems, internal audit systems, loan documentation, credit underwriting, interest rate exposure, asset growth, compensation, fees and benefits, asset quality and earnings.
Investments and Other Activities. Under federal law and FDIC regulations, FDIC insured state banks are prohibited, subject to certain exceptions, from making or retaining equity investments of a type, or in an amount, that are not permissible for a
national bank. Federal law, as implemented by FDIC regulations, also prohibits FDIC insured state banks and their subsidiaries, subject to certain exceptions, from engaging as principal in any activity that is not permitted for a national bank
or its subsidiary, respectively, unless the bank meets, and continues to meet, its minimum regulatory capital requirements and the FDIC determines the activity would not pose a significant risk to the Insurance Fund. Impermissible investments
and activities must be divested or discontinued within certain time frames set by the FDIC in accordance with federal law.
Consumer Protection Laws. The Bank's business includes making a variety of types of loans to individuals. In making these loans, we are subject to state usury and regulatory laws and to various federal laws and regulations, including the privacy of consumer
financial information provisions of the Gramm-Leach-Bliley Act, the Equal Credit Opportunity Act, the Fair Housing Act, the Servicemembers Civil Relief Act, the Fair Credit Reporting Act, the Truth in Lending Act, the Real Estate Settlement
Procedures Act, and the Home Mortgage Disclosure Act, which prohibit discrimination, specify disclosures to be made to borrowers regarding credit and settlement costs, and regulate the mortgage loan servicing activities of the Bank, including
the maintenance and operation of escrow accounts and the transfer of mortgage loan servicing. In receiving deposits, the Bank is subject to extensive regulation under state and federal law and regulations, including the Truth in Savings Act,
the Expedited Funds Availability Act, the Electronic Funds Transfer Act, the Federal Deposit Insurance Act and the privacy of consumer financial information provisions of the Gramm-Leach-Bliley Act. Violation of these laws could result in the
imposition of significant damages and fines upon the Bank and its directors and officers.
Anti-Money Laundering and OFAC Regulation. A major focus of governmental policy on financial institutions in recent years has been aimed at combating money laundering and terrorist financing. The Bank Secrecy Act of 1970 (“BSA”) and subsequent
laws and regulations require the Bank to take steps to prevent the use of the Bank or its systems from facilitating the flow of illegal or illicit money or terrorist funds. Those requirements include ensuring effective Board and management
oversight, establishing policies and procedures, performing comprehensive risk assessments, developing effective monitoring and reporting capabilities, ensuring adequate training and establishing a comprehensive independent audit of BSA
compliance activities.
The USA PATRIOT Act of 2001 ("Patriot Act") significantly expanded the anti-money laundering ("AML") and financial transparency laws and regulations by imposing significant new compliance and
due diligence obligations, creating new crimes and penalties and expanding the extra-territorial jurisdiction of the United States. Regulations promulgated under the Patriot Act impose various requirements on financial institutions, such as
standards for verifying client identification at account opening and maintaining expanded records (including "Know Your Customer" and "Enhanced Due Diligence" practices) and other obligations to maintain appropriate policies, procedures and
controls to aid the process of preventing, detecting, and reporting money laundering and terrorist financing. An institution subject to the Patriot Act must provide AML training to employees, designate an AML compliance officer and annually audit
the AML program to assess its effectiveness. The FDIC continues to issue regulations and additional guidance with respect to the application and requirements of BSA and AML.
The United States has imposed economic sanctions that affect transactions with designated foreign countries, nationals and others. Based on their administration by the United States Department
of the Treasury's Office of Foreign Assets Control ("OFAC"), these are typically known as the "OFAC" rules. The OFAC-administered sanctions targeting countries take many different forms. Generally, however, they contain one or more of the
following elements: (i) restrictions on trade with or investment in a sanctioned country, including prohibitions against direct or indirect imports from and exports to a sanctioned country and prohibitions on "United States persons" engaging in
financial transactions relating to making investments in, or providing investment-related advice or assistance to, a sanctioned country; and (ii) a blocking of assets in which the government or specially designated nationals of the sanctioned
country have an interest, by prohibiting transfers of property subject to United States jurisdiction (including property in the possession or control of United States persons). Blocked assets (e.g., property and bank deposits) cannot be paid out,
withdrawn, set off or transferred in any manner without a license from OFAC.
Failure of a financial institution to maintain and implement adequate BSA, AML and OFAC programs, or to comply with all of the relevant laws or regulations, could have serious legal and
reputational consequences for the institution and result in material fines and sanctions.
Branching Authority. Michigan banks have the authority under Michigan law to establish branches anywhere in the State of Michigan, subject to receipt of all required regulatory approvals. Banks may establish interstate branch networks through
acquisitions of other banks. The establishment of de novo interstate branches or the acquisition of individual branches of a bank in another state (rather than the acquisition of an out-of-state bank in its entirety) is allowed only if
specifically authorized by state law.
Michigan law permits both U.S. and non-U.S. banks to establish branch offices in Michigan. The Michigan Banking Code permits, in appropriate circumstances and with the approval of the DIFS,
(1) acquisition of Michigan banks by FDIC-insured banks, savings banks or savings and loan associations located in other states, (2) sale by a Michigan bank of branches to an FDIC-insured bank, savings bank or savings and loan association located
in a state in which a Michigan bank could purchase branches of the purchasing entity, (3) consolidation of Michigan banks and FDIC-insured banks, savings banks or savings and loan associations located in other states having laws permitting such
consolidation, (4) establishment of branches in Michigan by FDIC-insured banks located in other states, the District of Columbia or U.S. territories or protectorates having laws permitting a Michigan bank to establish a branch in such
jurisdiction, and (5) establishment by foreign banks of branches located in Michigan. A Michigan bank holding company may acquire a non-Michigan bank and a non-Michigan bank holding company may acquire a Michigan bank.
| ITEM 1A: |
Risk Factors.
|
Risks related to our Business
The continuing outbreak of COVID-19 and its related variants could adversely impact the Company’s and its customers’ business, financial condition, and
results of operations.
The continuing outbreak of COVID-19 and its related variants is disrupting the economy, financial markets, and societal norms in Michigan, the United States and across the world. Due to the
nature of the pandemic, uncertainty and fluidity of the spread of the virus, volatility of financial markets, and varied responses and actions from local, state and federal governments, including mandated shutdowns and other restrictive orders,
it is impossible to predict the ultimate adverse impact COVID-19 could have on the Company and its customers. The effects of COVID-19 could, among other risks, result in a material increase in requests from the Company’s customers for loan
deferrals, modifications to the terms of loans, or other borrower accommodations; have a material adverse impact on the financial condition of the Company’s customers, potentially impacting their ability to make payments to the Company as
scheduled and driving an increase in delinquencies and loan losses; result in additional material provision for loan losses; result in a decreased demand for the Company’s loans; or negatively impact the Company’s ability to access capital on
attractive terms or at all. Those effects could have a material adverse impact on the Company’s and its customers’ business, financial condition, and results of operations.
Our nonperforming assets and other problem loans could have an
adverse effect on the Company's results of operations and financial condition.
Our nonperforming assets (which includes non-accrual loans, foreclosed properties and other accruing loans past due 90 days or more) were approximately $2.4 million at December 31, 2021. These
assets could negatively impact operating results through higher loan losses, lost interest and higher costs to administer problem assets.
National, state and local economic conditions could have a material
adverse effect on the Company's results of operations and financial condition.
The results of operations for financial institutions, including our Bank, may be materially and adversely affected by changes in prevailing national, state and local economic conditions. Our
profitability is heavily influenced by the quality of the Company's loan portfolio and the stability of the Company's deposits. Unlike larger national or regional banks that are more geographically diversified, the Company provides banking and
financial services to customers primarily in Ottawa, Kent and Allegan Counties of western Michigan. The local economic conditions in these areas have a significant impact on the demand for the Company's products and services, and the ability of
the Company's customers to repay loans, the value of the collateral securing loans and the stability of the Company's deposit funding sources. A significant decline in general economic conditions, caused by inflation, recession, acts of
terrorism, outbreak of hostilities, an outbreak of a widespread epidemic or pandemic of disease (or widespread fear thereof) or other international or domestic occurrences, unemployment, changes in securities, financial, capital or credit markets
or other factors, could impact national and local economic conditions and have a material adverse effect on the Company's results of operations and financial condition.
Our credit losses could increase and our allowance for loan losses may not be adequate to cover actual loan losses.
The risk of nonpayment of loans is inherent in all lending activities and nonpayment of loans may have a material adverse effect on our earnings and overall financial condition, and the value
of our common stock. We make various assumptions and judgments about the collectability of our loan portfolio and provide an allowance for potential losses based on a number of factors. If our assumptions are wrong, our allowance for loan losses
may not be sufficient to cover our losses, which could have an adverse effect on our operating results, and may cause us to increase the allowance in the future. The actual amount of future provisions for loan losses cannot now be determined and
may exceed the amounts of past provisions for loan losses. Federal and state banking regulators, as an integral part of their supervisory function, periodically review our allowance for loan losses. These regulatory agencies may require us to
increase our provision for loan losses or to recognize further loan charge-offs based upon their judgments, which may be different from ours. Any increase in the allowance for loan losses could have a negative effect on our regulatory capital
ratios, net income, financial condition and results of operations.
We are subject to liquidity risk in our operations, which could adversely affect our ability to fund various obligations.
Liquidity risk is the possibility of being unable to meet obligations as they come due, pay deposits when withdrawn, and fund loan and investment opportunities as they arise because of an
inability to liquidate assets or obtain adequate funding on a timely basis, at a reasonable cost and within acceptable risk tolerances. Liquidity is required to fund various obligations, including credit obligations to borrowers, mortgage
originations, withdrawals by depositors, repayment of debt, operating expenses and capital expenditures. Liquidity of the Bank is derived primarily from retail deposit growth and retention, principal and interest payments on loans and investment
securities, net cash provided from operations and access to other funding sources. Liquidity is essential to our business. We must maintain sufficient funds to respond to the needs of depositors and borrowers. An inability to raise funds through
deposits, borrowings, the sale or pledging as collateral of loans and other assets could have a material adverse effect on our liquidity. An inability to retain the current level of deposits, including the loss of one or more of the Bank's
larger deposit relationships, could have a material adverse effect on the Bank's liquidity. Our access to funding sources in amounts adequate to finance activities could be impaired by factors that affect us specifically or the financial
services industry in general. Factors that could detrimentally impact our access to liquidity sources include a decrease in the level of the business activity due to a market down turn or regulatory action that limits or eliminates access to
alternate funding sources, including brokered deposits discussed above. Our ability to borrow could also be impaired by factors that are nonspecific to the Company, such as severe disruption of the financial markets or negative expectations about
the prospects for the financial services industry as a whole.
Our construction and development lending exposes us to significant risks.
Construction and development loans consist of loans to commercial customers for the construction of their business facilities. They also include construction loans to builders and developers
for the construction of one- to four-family residences and the development of one- to four-family lots, residential subdivisions, condominium developments and other commercial developments. This portfolio may be particularly adversely affected
by job losses, declines in real estate values, declines in home sale volumes, and declines in new home building. Declining real estate values may result in sharp increases in losses, particularly in the land development and construction loan
portfolios to residential developers. This type of lending is generally considered to have more complex credit risks than traditional single-family residential lending because the principal is concentrated in a limited number of loans with
repayment dependent on the successful completion and sales of the related real estate project. Consequently, these loans are often more sensitive to adverse conditions in the real estate market or the general economy than other real estate
loans. These loans are generally less predictable and more difficult to evaluate and monitor and collateral may be difficult to dispose of in a market decline. Additionally, we may experience significant construction loan losses if independent
appraisers or project engineers inaccurately estimate the cost and value of construction loan projects.
We have significant exposure to risks associated with commercial and residential real estate.
A substantial portion of our loan portfolio consists of commercial and residential real estate-related loans, including real estate development, construction and residential and commercial
mortgage loans. As of December 31, 2021, we had approximately $516.1 million of commercial real estate loans outstanding, which represented approximately 46.5% of our loan portfolio. As of that same date, we had approximately $117.8 million in
residential real estate loans outstanding, or approximately 10.7% of our loan portfolio. Consequently, real estate-related credit risks are a significant concern for us. The adverse consequences from real estate-related credit risks tend to be
cyclical and are often driven by national economic developments that are not controllable or entirely foreseeable by us or our borrowers.
Commercial loans may expose us to greater financial and credit risk than other loans.
Our commercial loan portfolio, including commercial mortgages, was approximately $936.4 million at December 31, 2021, comprising approximately 84.4% of our total loan portfolio. Commercial
loans generally carry larger loan balances and can involve a greater degree of financial and credit risk than other loans. Any significant failure to pay on time by our customers would hurt our earnings. The increased financial and credit risk
associated with these types of loans are a result of several factors, including the concentration of principal in a limited number of loans and borrowers, the size of loan balances, the effects of general economic conditions on income-producing
properties and the increased difficulty of evaluating and monitoring these types of loans. In addition, when underwriting a commercial or industrial loan, we may take a security interest in commercial real estate, and, in some instances upon a
default by the borrower, we may foreclose on and take title to the property, which may lead to potential financial risks for us under applicable environmental laws. If hazardous substances were discovered on any of these properties, we may be
liable to governmental agencies or third parties for the costs of remediation of the hazard, as well as for personal injury and property damage. Many environmental laws can impose liability regardless of whether we knew of, or were responsible
for, the contamination.
Our loan portfolio has and will continue to be affected by the housing market.
Loans to residential developers involved in the development or sale of 1-4 family residential properties were approximately $16.1 million, $21.4 million and $36.3 million at December 31, 2021,
2020 and 2019, respectively. As we continue our on-going portfolio monitoring, we will make credit and reserve decisions based on the current conditions of the borrower or project combined with our expectations for the future. If the housing
market deteriorates, we could experience higher charge-offs and delinquencies in this portfolio.
We may face pressure from historical purchasers of our residential mortgage loans to repurchase those loans or reimburse purchasers for losses related to
those loans.
We generally sell the fixed rate long-term residential mortgage loans we originate on the secondary market and retain adjustable rate mortgage loans for our portfolios. Purchasers of
residential mortgage loans, such as government sponsored entities, may seek to require sellers of residential mortgage loans to either repurchase loans previously sold or reimburse purchasers for losses related to loans previously sold when
losses are incurred on a loan previously sold due to actual or alleged failure to strictly conform to the purchaser's purchase criteria. We may face claims from historical purchasers of our residential mortgage loans to repurchase those loans or
reimburse purchasers for losses related to those loans and we may face increasing expenses to defend against such claims. If we are required in the future to repurchase loans previously sold, reimburse purchasers for losses related to loans
previously sold, or if we incur increasing expenses to defend against such claims, our financial condition and results of operations would be negatively affected, and would lower our capital ratios as a result of increasing assets and lowering
income through expenses and any loss incurred.
For the five-year period ended December 31, 2021, the Company has sold an aggregate of $470.7 million of residential mortgage loans on the secondary market. As of December 31, 2021, the
Company had no pending repurchase demands or claims related to residential mortgage loans sold on the secondary market during the five-year period ended December 31, 2021.
Changes in interest rates may negatively affect our earnings and the value of our assets.
Our earnings and cash flows depend substantially upon our net interest income. Net interest income is the difference between interest income earned on interest-earning assets, such as loans
and investment securities, and interest expense paid on interest-bearing liabilities, such as deposits and borrowed funds. Interest rates are sensitive to many factors that are beyond our control, including general economic conditions,
competition and policies of various governmental and regulatory agencies and, in particular, the policies of the Federal Reserve Board. Changes in monetary policy, including changes in interest rates, could influence not only the interest we
receive on loans and investment securities and the amount of interest we pay on deposits and borrowings, but such changes could also affect: (i) our ability to originate loans and obtain deposits; (ii) the fair value of our financial assets and
liabilities, including our securities portfolio; and (iii) the average duration of our interest-earning assets. This also includes the risk that interest-earning assets may be more responsive to changes in interest rates than interest-bearing
liabilities, or vice versa (repricing risk), the risk that the individual interest rates or rates indices underlying various interest-earning assets and interest-bearing liabilities may not change in the same degree over a given time period
(basis risk), and the risk of changing interest rate relationships across the spectrum of interest-earning asset and interest-bearing liability maturities (yield curve risk), including a prolonged flat or inverted yield curve environment. Any
substantial, unexpected, prolonged change in market interest rates could have a material adverse effect on our financial condition and results of operations.
We are subject to significant government regulation, and any regulatory changes may adversely affect us.
The banking industry is heavily regulated under both federal and state law. These regulations are primarily intended to protect customers and the Deposit Insurance Fund, not our creditors or
shareholders. We are subject to extensive regulation by the Federal Reserve, the FDIC and the DIFS, in addition to other regulatory and self-regulatory organizations. Future regulatory changes or accounting pronouncements may increase our
regulatory capital requirements or adversely affect our regulatory capital levels. Regulations affecting banks and financial services companies undergo continuous change, and we cannot predict the ultimate effect of such changes, which could
have a material adverse effect on our profitability or financial condition.
The Company could be adversely affected by the soundness of other financial institutions, including defaults by larger financial institutions.
The Company's ability to engage in routine funding transactions could be adversely affected by the actions and commercial soundness of other financial institutions. Financial services
institutions are interrelated as a result of credit, trading, clearing, counterparty or other relationships between financial institutions. The Company has exposure to multiple counterparties, and the Company routinely executes transactions with
counterparties in the financial industry. As a result, defaults by, or even rumors or questions about, one or more financial services institutions, or the financial services industry generally, could lead to market-wide liquidity problems and
losses or defaults by the Company or by other institutions. This is sometimes referred to as "systemic risk" and may adversely affect financial intermediaries, such as clearing agencies, clearing houses, banks, securities firms and exchanges,
with which the Company interacts on a daily basis, and therefore could adversely affect the Company.
We rely heavily on our management and other key personnel, and the loss of any of them may adversely affect our operations.
We are and will continue to be dependent upon the services of our management team and other key personnel. Losing the services of one or more key members of our management team could adversely
affect our operations.
Our controls and procedures may fail or be circumvented.
Management regularly reviews and updates our internal controls, disclosure controls and procedures, and corporate governance policies and procedures. Any system of controls, however well
designed and operated, is based in part on certain assumptions and can provide only reasonable, not absolute, assurances that the objectives of the system are met. If we fail to identify and remediate control deficiencies, it is possible that a
material misstatement of interim or annual financial statements will not be prevented or detected on a timely basis. In addition, any failure or circumvention of our other controls and procedures or failure to comply with regulations related to
controls and procedures could have a material adverse effect on our business, results of operations and financial condition.
The Bank may be required to pay additional insurance premiums to the FDIC, which could negatively impact earnings.
Depending upon any future losses that the FDIC insurance fund may suffer, there can be no assurance that there will not be additional premium increases in order to replenish the fund. The FDIC
may need to set a higher base rate schedule or impose special assessments due to future financial institution failures and updated failure and loss projections. Increased FDIC assessment rates could have an adverse impact on our results of
operations.
If we cannot raise additional capital when needed, our ability to further expand our operations through organic growth and acquisitions could be
materially impaired.
We are required by federal and state regulatory authorities to maintain specified levels of capital to support our operations. We may need to raise additional capital to support our current
level of assets or our growth. Our ability to raise additional capital will depend on conditions in the capital markets at that time, which are outside our control, and on our financial performance. We cannot assure that we will be able to
raise additional capital in the future on terms acceptable to us or at all. If we cannot raise additional capital when needed, our ability to expand our operations through organic growth or acquisitions could be materially limited. Additional
information on the capital requirements applicable to the Bank may be found under the heading "Regulatory Capital" in Note 19 in Item 8.
We may be a defendant in a variety of litigation and other actions, which may have a material adverse effect on our financial condition and results of
operations.
We may be involved from time to time in a variety of litigation arising out of our business. Our insurance may not cover all claims that may be asserted against us, and any claims asserted
against us, regardless of merit or eventual outcome, may harm our reputation or cause us to incur unexpected expenses, which could be material in amount. Should the ultimate expenses, judgments or settlements in any litigation exceed our
insurance coverage, they could have a material adverse effect on our financial condition and results of operations. In addition, we may not be able to obtain appropriate types or levels of insurance in the future, and we may not be able to obtain
adequate replacement of our existing policies with acceptable terms, if at all.
Our future success is dependent on our ability to compete effectively in the highly competitive banking industry.
We face substantial competition in all phases of our operations from a variety of different competitors. Our future growth and success will depend on our ability to compete effectively in this
highly competitive environment. We compete for deposits, loans and other financial services with numerous Michigan-based and out-of-state banks, thrifts, credit unions and other financial institutions as well as other entities which provide
financial services, including technology-oriented financial services (FinTech) companies. Some of the financial institutions and financial services organizations with which we compete are not subject to the same degree of regulation as we are.
Most of our competitors have been in business for many years, have established customer bases, are larger, and have substantially higher lending limits than we do. The financial services industry is also likely to become more competitive as
further technological advances enable more companies to provide financial services. Competition for limited, high-quality lending opportunities and core deposits in an increasingly competitive marketplace may adversely affect our results of
operations.
Evaluation of investment securities for other-than-temporary
impairment involves subjective determinations and could materially impact our results of operations and financial condition.
The evaluation of impairments is a quantitative and qualitative process, which is subject to risks and uncertainties and is intended to determine whether declines in the fair value of
investments should be recognized in current period earnings. The risks and uncertainties include changes in general economic conditions, the issuer's financial condition or future recovery prospects, the effects of changes in interest rates or
credit spreads and the expected recovery period. Estimating future cash flows involves incorporating information received from third-party sources and making internal assumptions and judgments regarding the future performance of the underlying
collateral and assessing the probability that an adverse change in future cash flows has occurred. The determination of the amount of other-than-temporary impairments is based upon our periodic evaluation and assessment of known and inherent
risks associated with the respective asset class. Such evaluations and assessments are revised as conditions change and new information becomes available. Our management considers a wide range of factors about the security issuer and uses
reasonable judgment in evaluating the cause of the decline in the estimated fair value of the security and in assessing the prospects for recovery. Inherent in management's evaluation of the security are assumptions and estimates about the
operations of the issuer and its future earnings potential. Impairments to the carrying value of our investment securities may need to be taken in the future, which could have a material adverse effect on our results of operations and financial
condition.
We depend upon the accuracy and completeness of information about customers.
In deciding whether to extend credit to customers, we rely on information provided to us by our customers, including financial statements and other financial information. We also rely on
representations of customers as to the accuracy and completeness of that information and, with respect to financial statements, on reports of independent auditors. Our financial condition and results of operations could be negatively impacted to
the extent that we extend credit in reliance on financial statements or other information provided by customers that is false, misleading or incomplete.
Unauthorized disclosure of sensitive or confidential client or customer information, whether through a breach of computer systems or otherwise, or failure
or interruption of the Company's communication or information systems, could severely harm the Company’s business.
As part of its business, the Company collects, processes and retains sensitive and confidential client and customer information on behalf of the Company and other third parties. Despite the
security measures the Company has in place for its facilities and systems, and the security measures of its third party service providers, the Company may be vulnerable to security breaches, acts of vandalism, computer viruses, misplaced or lost
data, programming and/or human errors or other similar events.
The Company relies heavily on communications and information systems to conduct its business. Any failure or interruption of these systems could result in failures or disruptions in the
Company’s customer relationship management, general ledger, deposit, loan and other systems. In addition, customers could lose access to their accounts and be unable to conduct financial transactions during a period of failure or interruption of
these systems.
Any security breach involving the misappropriation, loss or other unauthorized disclosure of confidential customer information, whether such information is held by the Company or by its
vendors, or failure or interruption of the Company's communication or information systems, could severely damage the Company’s reputation, expose it to risks of regulatory scrutiny, litigation and liability, disrupt the Company’s operations, or
result in a loss of customer business, the occurrence of any of which could have a material adverse effect on the Company’s business.
Cybersecurity incidents could disrupt business operations, result in the loss of critical and confidential information, and adversely impact our
reputation and results of operations.
Cybersecurity threats and incidents can range from uncoordinated individual attempts to gain unauthorized access to information technology (IT) systems to sophisticated and targeted measures
known as advanced persistent threats, directed at the Company and/or its third party service providers. While we have experienced, and expect to continue to experience, these types of threats and incidents, none of them to date have been material
to the Company. Although we employ comprehensive measures to prevent, detect, address and mitigate these threats (including access controls, employee training, data encryption, vulnerability assessments, continuous monitoring of our IT networks
and systems and maintenance of backup and protective systems), cybersecurity incidents, depending on their nature and scope, could potentially result in the misappropriation, destruction, corruption or unavailability of critical data and
confidential or proprietary information (our own or that of third parties) and the disruption of business operations. The potential consequences of a material cybersecurity incident include reputational damage, litigation with third parties and
increased cybersecurity protection and remediation costs, which in turn could materially adversely affect our results of operations.
We continually encounter technological change, and we may have fewer resources than our competitors to continue to invest in technological improvements.
The banking industry is undergoing rapid technological changes with frequent introductions of new technology-driven products and services. In addition to better serving customers, the
effective use of technology increases efficiency and enables financial institutions to reduce costs. Our future success will depend, in part, on our ability to address the needs of our customers by using technology to provide products and
services that will satisfy customer demands for convenience as well as to create additional efficiencies in our operations. Many of our competitors have substantially greater resources to invest in technological improvements. There can be no
assurance that we will be able to effectively implement new technology-driven products and services or be successful in marketing such products and services to our customers.
An "ownership change" for purposes of Section 382 of the Internal Revenue Code could materially impair our ability to use our deferred tax assets.
At December 31, 2021, our gross deferred tax asset was $4.1 million. Our ability to use our deferred tax assets to offset future taxable income will be limited if we experience an "ownership
change" as defined in Section 382 of the Internal Revenue Code. In general, an ownership change will occur if there is a cumulative increase in our ownership by "5-percent shareholders" (as defined in the Code) that exceeds 50 percentage points
over a rolling three-year period. A corporation that experiences an ownership change will generally be subject to an annual limitation on the use of its pre-ownership change deferred tax assets equal to the equity value of the corporation
immediately before the ownership change, multiplied by the long-term tax-exempt rate.
If an "ownership change" occurs, we could lose certain built-in losses that have not been recognized for tax purposes. The amount of the permanent loss would depend on the size of the annual
limitation (which is in part a function of our market capitalization at the time of an "ownership change") and the remaining carry forward period (U.S. federal net operating losses generally may be carried forward for a period of 20 years).
Our ability to maintain, attract and retain customer relationships is highly dependent on our reputation.
Our customers rely on us to deliver superior, personalized financial services with the highest standards of ethics, performance, professionalism and compliance. Damage to our reputation could
undermine the confidence of our current customers and our ability to attract potential customers. Such damage could also impair the confidence of our contractual counterparties and vendors and ultimately affect our ability to effect transactions.
Maintenance of our reputation depends not only on our success in maintaining our service-focused culture and controlling and mitigating the various risks described herein, but also on our success in identifying and appropriately addressing issues
that may arise in areas such as potential conflicts of interest, anti-money laundering, client personal information and privacy issues, employee, customer and other third party fraud, record-keeping, regulatory investigations and any litigation
that may arise from the failure or perceived failure of us to comply with legal and regulatory requirements.
Employee misconduct could expose us to significant legal liability and reputational harm.
We are vulnerable to reputational harm because we operate in an industry in which integrity and the confidence of our customers are of critical importance. Our employees could engage in
misconduct that adversely affects our customers, other employees, and/or our business. For example, if an employee were to engage in fraudulent, illegal, wrongful or suspicious activities, and/or activities resulting in consumer harm, we could be
subject to litigation, regulatory sanctions or penalties, and suffer serious harm to our reputation (as a consequence of the negative perception resulting from such activities), financial position, customer relationships and ability to attract
new customers. Our business often requires that we deal with confidential information. If our employees were to improperly use or disclose this information, even if inadvertently, we could suffer serious harm to our reputation, financial position
and current and future business relationships. It is not always possible to deter employee misconduct, and the precautions we take to detect and prevent this activity may not always be effective. Misconduct or harassment by our employees, or even
unsubstantiated allegations of misconduct or harassment, or improper use or disclosure of confidential information by our employees, even inadvertently, could result in a material adverse effect on our business, financial condition or results of
operations.
Our operations could be interrupted if certain external vendors on which we rely experience difficulty, terminate their services or fail to comply with
banking laws and regulations.
We depend to a significant extent on relationships with third party service providers. Specifically, we utilize third party core banking services and receive credit card and debit card
services, branch capture services, Internet banking services and services complementary to our banking products from various third party service providers. If these third party service providers experience difficulties or terminate their services
and we are unable to replace them with other service providers, our operations could be interrupted. It may be difficult for us to replace some of our third party vendors, particularly vendors providing our core banking, credit card and debit
card services, in a timely manner if they were unwilling or unable to provide us with these services in the future for any reason. If an interruption were to continue for a significant period of time, it could have a material adverse effect on
our business, financial condition or results of operations. Even if we are able to replace them, it may be at higher cost to us, which could have a material adverse effect on our business, financial condition or results of operations.
Uncertainty relating to the LIBOR calculation process and potential phasing out of LIBOR may adversely affect our results of operations.
On July 27, 2017, the Chief Executive of the United Kingdom Financial Conduct Authority, which regulates LIBOR, announced that it intends to stop persuading or compelling banks to submit rates
for the calculation of LIBOR to the administrator of LIBOR after 2021. In November 2020, the Financial Conduct Authority announced that it would continue to publish LIBOR rates through June 30, 2023. It is unclear whether, or in what form, LIBOR
will continue to exist after that date. At this time, it appears that market consensus is building around using the Secured Overnight Financing Rate ("SOFR") as an acceptable alternative reference rate to LIBOR, though that remains to be
determined. SOFR may fail to gain market acceptance. SOFR was developed for use in certain U.S. dollar derivatives and other financial contracts as an alternative to U.S. dollar LIBOR in part because it is considered to be a good representation
of general funding conditions in the overnight U.S. Treasury repo market. However, as a rate based on transactions secured by U.S. Treasury securities, it does not measure bank-specific credit risk and, as a result, is less likely to correlate
with the unsecured short-term funding costs of banks. This may mean that market participants would not consider SOFR to be a suitable substitute or successor for all of the purposes for which U.S. dollar LIBOR historically has been used, which
may, in turn, lessen its market acceptance.
It is impossible to predict the effect of SOFR or any other alternative reference rate on the value of LIBOR-based securities and variable rate loans, subordinated debentures, or other
securities or financial arrangements, given LIBOR's role in determining market interest rates globally. Uncertainty as to the nature of alternative reference rates and as to potential changes or other reforms to LIBOR may adversely affect LIBOR
rates and the value of LIBOR-based loans and securities in our portfolio, and may impact the availability and cost of hedging instruments and borrowings. If LIBOR rates are no longer available, and we are required to implement alternative
reference rates, such as SOFR, for the calculation of interest rates under our loan agreements with our borrowers, we may incur significant expenses in effecting the transition, and may be subject to disputes or litigation with customers over the
appropriateness or comparability of LIBOR to SOFR or another alternative reference rate, which could have an adverse effect on our results of operations.
Risks Associated With the Company's Stock
The market price of our common stock can be volatile, which may make it more difficult to resell our common stock at a desired time and price.
Stock price volatility may make it more difficult for a shareholder to resell our common stock when a shareholder wants to and at prices a shareholder finds attractive or at all. Our stock
price can fluctuate significantly in response to a variety of factors, regardless of operating results. These factors include, among other things:
| • |
Variations in our anticipated or actual operating results or the results of our competitors;
|
| • |
Changes in investors' or analysts' perceptions of the risks and conditions of our business;
|
| • |
The size of the public float of our common stock;
|
| • |
Regulatory developments, including changes to regulatory capital levels, components of regulatory capital and how regulatory capital is calculated;
|
| • |
Interest rate changes or credit loss trends;
|
| • |
Trading volume in our common stock;
|
| • |
Market conditions; and
|
| • |
General economic conditions.
|
The Company may issue additional shares of its common stock in the future, which could dilute a shareholder's ownership of common stock.
The Company's articles of incorporation authorize its Board of Directors, without shareholder approval, to, among other things, issue additional shares of common or preferred stock. The
issuance of any additional shares of common or preferred stock could be dilutive to a shareholder's ownership of Company common stock.
To the extent that the Company issues options or warrants to purchase common stock in the future and the options or warrants are exercised, the Company's shareholders may experience further
dilution. Holders of shares of Company common stock have no preemptive rights that entitle holders to purchase their pro rata share of any offering of shares of any class or series and, therefore, shareholders may not be permitted to invest in
future issuances of Company common or preferred stock.
Although publicly traded, our common stock has substantially less liquidity than the average liquidity of stocks listed on The Nasdaq Global Select
Market.
Although our common stock is listed for trading on The Nasdaq Global Select Market, our common stock has substantially less liquidity than the average liquidity for companies listed on The
Nasdaq Global Select Market. A public trading market having the desired characteristics of depth, liquidity and orderliness depends on the presence in the marketplace of willing buyers and sellers of our common stock at any given time. This
marketplace depends on the individual decisions of investors and general economic and market conditions over which we have no control. This limited market may affect a shareholder’s ability to sell their shares on short notice, and the sale of a
large number of shares at one time could temporarily depress the market price of our common stock. For these reasons, our common stock should not be viewed as a short-term investment.
The Company's common stock is not insured by any governmental entity.
Our common stock is not a deposit account or other obligation of any bank and is not insured by the FDIC or any other governmental entity. Investment in Company common stock is subject to
risk, including possible loss.
The Company may issue debt and equity securities that are senior to Company common stock as to distributions and in liquidation, which could negatively
affect the value of Company common stock.
The Company has in the past and may in the future increase its capital by entering into debt or debt-like financing or issuing debt or equity securities, which could include issuances of senior
notes, subordinated notes, preferred stock or common stock. In the event of the Company's liquidation, its lenders and holders of its debt securities would receive a distribution of the Company's available assets before distributions to the
holders of Company common stock. The Company's decision to incur debt and issue securities in future offerings will depend on market conditions and other factors beyond its control. The Company cannot predict or estimate the amount, timing or
nature of its future offerings and debt financings. Future offerings could reduce the value of shares of Company common stock and dilute a shareholder's interest in the Company.
Our articles of incorporation and bylaws and Michigan laws contain certain provisions that could make a takeover more difficult.
Our articles of incorporation and bylaws, and the laws of Michigan, include provisions which are designed to provide our Board of Directors with time to consider whether a hostile takeover
offer is in our best interest and the best interests of our shareholders. These provisions could discourage potential acquisition proposals and could delay or prevent a change in control. The provisions also could diminish the opportunities for a
holder of our common stock to participate in tender offers, including tender offers at a price above the then-current price for our common stock. These provisions could also prevent transactions in which our shareholders might otherwise receive a
premium for their shares over then current market prices, and may limit the ability of our shareholders to approve transactions that they may deem to be in their best interests.
The Michigan Business Corporation Act contains provisions intended to protect shareholders and prohibit or discourage certain types of hostile takeover activities. In addition to these
provisions and the provisions of our articles of incorporation and bylaws, federal law requires the Federal Reserve Board's approval prior to acquisition of "control" of a bank holding company. All of these provisions may have the effect of
delaying or preventing a change in control of the Company without action by our shareholders, and therefore, could adversely affect the price of our common stock.
If an entity holds as little as a 5% interest in our outstanding securities, that entity could, under certain circumstances, be subject to regulation as a
"bank holding company."
Any entity, including a "group" composed of natural persons, owning or controlling with the power to vote 25% or more of our outstanding securities, or 5% or more if the holder otherwise
exercises a "controlling influence" over us, may be subject to regulation as a "bank holding company" in accordance with the Bank Holding Company Act of 1956, as amended (the "BHC Act"). In addition, any bank holding company or foreign bank with
a U.S. presence may be required to obtain the approval of the Federal Reserve Board under the BHC Act to acquire or retain 5% or more of our outstanding securities. Becoming a bank holding company imposes statutory and regulatory restrictions
and obligations, such as providing managerial and financial strength for its bank subsidiaries. Regulation as a bank holding company could require the holder to divest all or a portion of the holder's investment in our securities or those
nonbanking investments that may be deemed impermissible or incompatible with bank holding company status, such as a material investment in a company unrelated to banking.
Any person not defined as a company by the BHC Act may be required to obtain the approval of the Federal Reserve Board under the Change in Bank Control
Act of 1978, as amended, to acquire or retain 10% or more of our outstanding securities.
Any person not otherwise defined as a company by the BHC Act and its implementing regulations may be required to obtain the approval of the Federal Reserve Board under the Change in Bank
Control Act of 1978, as amended, to acquire or retain 10% or more of our outstanding securities. Applying to obtain this approval could result in a person incurring substantial costs and time delays. There can be no assurance that regulatory
approval will be obtained.
| ITEM 1B: |
Unresolved Staff Comments.
|
None.
| ITEM 2: |
Properties.
|
We own or lease facilities located in Ottawa County, Allegan County and Kent County, Michigan. Our administrative offices are located at 10753 Macatawa Drive, Holland, Michigan 49424. Our
administrative offices are approximately 49,000 square feet and contain our administration, human resources, trust, loan underwriting and processing, and deposit operations. We believe our facilities are well-maintained and adequately insured.
We own each of the facilities except those identified in the “Use” column as “(Leased facility)”. Our facilities as of February 17, 2022, were as follows:
|
Location of Facility
|
Use
|
|
10753 Macatawa Drive, Holland
|
Main Branch, Administrative, and Loan Processing Offices
|
|
815 E. Main Street, Zeeland
|
Branch Office
|
|
116 Ottawa Avenue N.W., Grand Rapids
|
Branch Office (Leased facility, lease expires December 2025)
|
|
126 Ottawa Avenue N.W., Grand Rapids
|
Loan Center (Leased facility, lease expires December 2022)
|
|
141 E. 8th Street, Holland
|
Branch Office
|
|
489 Butternut Dr., Holland
|
Branch Office
|
|
701 Maple Avenue, Holland
|
Branch Office
|
|
699 E. 16th Street, Holland
|
Branch Office
|
|
41 N. State Street, Zeeland
|
Branch Office
|
|
2020 Baldwin Street, Jenison
|
Branch Office
|
|
6299 Lake Michigan Dr., Allendale
|
Branch Office
|
|
132 South Washington, Douglas
|
Branch Office
|
|
4758 – 136th Street, Hamilton
|
Branch Office (Leased facility, lease expires December 2022)
|
|
3526 Chicago Drive, Hudsonville
|
Branch Office
|
|
20 E. Lakewood Blvd., Holland
|
Branch Office
|
|
3191 – 44th Street, S.W., Grandville
|
Branch Office
|
|
2261 Byron Center Avenue S.W., Byron Center
|
Branch Office
|
|
5271 Clyde Park Avenue, S.W., Wyoming
|
Branch Office
|
|
4590 Cascade Road, Grand Rapids
|
Branch Office
|
|
3177 Knapp Street, N.E., Grand Rapids
|
Branch Office
|
|
15135 Whittaker Way, Grand Haven
|
Branch Office
|
|
12415 Riley Street, Holland
|
Branch Office
|
|
2750 Walker N.W., Walker
|
Branch Office
|
|
1575 – 68th Street S.E., Grand Rapids
|
Branch Office
|
|
2820 – 10 Mile Road, Rockford
|
Branch Office
|
|
520 Baldwin Street, Jenison
|
Branch Office
|
|
2440 Burton Street, S.E., Grand Rapids
|
Branch Office
|
|
6330 28 th Street, S.E., Grand Rapids
|
Branch Office
|
| ITEM 3: |
Legal Proceedings.
|
As of the date of this report, there were no material pending legal proceedings, other than routine litigation incidental to the business of banking, to which Macatawa Bank Corporation or the
Bank are a party or of which any of our properties are the subject.
| ITEM 4: |
Mine Safety Disclosures.
|
Not applicable.
| ITEM 5: |
Market for Registrant's Common Equity, Related Stockholder Matters and Issuer Purchases of Equity Securities.
|
Our common stock is quoted on The Nasdaq Global Select Market under the symbol MCBC. High and low closing prices (as reported on The Nasdaq Global Select Market) of our common stock for each
quarter for the years ended December 31, 2021 and 2020 are set forth in the table below.
|
2021
|
2020
|
|||||||||||||||||||||||
|
Quarter
|
High
|
Low
|
Dividends
Declared
|
High
|
Low
|
Dividends
Declared
|
||||||||||||||||||
|
First Quarter
|
$
|
10.66
|
$
|
8.17
|
$
|
0.08
|
$
|
11.24
|
$
|
6.01
|
$
|
0.08
|
||||||||||||
|
Second Quarter
|
10.15
|
8.74
|
0.08
|
8.48
|
6.15
|
0.08
|
||||||||||||||||||
|
Third Quarter
|
8.90
|
7.37
|
0.08
|
7.97
|
6.23
|
0.08
|
||||||||||||||||||
|
Fourth Quarter
|
9.08
|
7.96
|
0.08
|
8.75
|
6.45
|
0.08
|
||||||||||||||||||
Information on restrictions on payments of dividends by us may be found in Item 1 of this report under the heading “Supervision and Regulation” and is here incorporated by reference.
Information regarding our equity compensation plans may be found in Item 12 of this report and is here incorporated by reference.
On February 17, 2022, there were approximately 740 owners of record and approximately 7,611 beneficial owners of our common stock.
Shareholder Return Performance Graph
The following graph shows the cumulative total shareholder return on an investment in the Company’s common stock compared to the Russell 2000 Index and the KBW Bank NASDAQ Index. The
comparison assumes a $100 investment on December 31, 2016 at the initial price of $10.41 per share (adjusted for all stock dividends and splits) and assumes that dividends are reinvested. The comparisons in this table are set forth in response
to Securities and Exchange Commission (SEC) disclosure requirements and therefore are not intended to forecast or be indicative of future performance of the common stock.
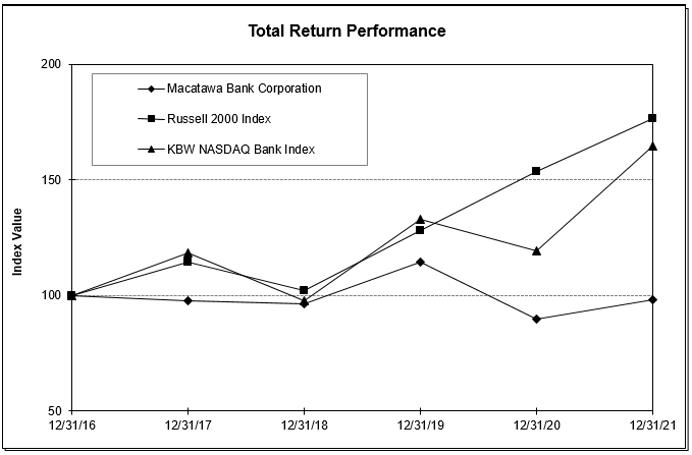
|
Period Ending
|
||||||||||||||||||||||||
|
Index
|
12/31/16
|
12/31/17
|
12/31/18
|
12/31/19
|
12/31/20
|
12/31/21
|
||||||||||||||||||
|
Macatawa Bank Corporation
|
100.00
|
97.89
|
96.33
|
114.49
|
89.65
|
97.96
|
||||||||||||||||||
|
Russell 2000
|
100.00
|
114.65
|
102.02
|
128.06
|
153.62
|
176.39
|
||||||||||||||||||
|
KBW Bank NASDAQ
|
100.00
|
118.59
|
97.58
|
132.84
|
119.14
|
164.80
|
||||||||||||||||||
Issuer Purchases of Equity Securities
The following table provides information regarding the Company’s purchase of its own common stock during the fourth quarter of 2021. All employee transactions are under stock compensation
plans. These include shares of Macatawa Bank Corporation common stock surrendered for cancellation to satisfy tax withholding obligations that occur upon the vesting of restricted shares. The value of the shares withheld is determined based on
the closing price of Macatawa Bank Corporation common stock at the date of vesting. The Company has no publicly announced repurchase plans or programs.
|
Macatawa Bank Corporation Purchases of Equity Securities
|
||||||||
|
Total
Number of
Shares
Purchased
|
Average
Price Paid
Per Share
|
|||||||
|
Period
|
||||||||
|
October 1 - October 31, 2021
|
||||||||
|
Employee Transactions
|
—
|
—
|
||||||
|
November 1 - November 30, 2021
|
||||||||
|
Employee Transactions
|
10,928
|
$
|
8.80
|
|||||
|
December 1 - December 31, 2021
|
||||||||
|
Employee Transactions
|
—
|
—
|
||||||
|
Total for Fourth Quarter ended December 31, 2021
|
||||||||
|
Employee Transactions
|
10,928
|
$
|
8.80
|
|||||
| ITEM 6: |
[Reserved]
|
| ITEM 7. |
Management’s Discussion and Analysis of Results of Operations and Financial Condition.
|
Selected Financial Data.
The following unaudited table sets forth selected historical consolidated financial information as of and for the years ended December 31, 2021, 2020, 2019, 2018 and 2017, which is derived from
our audited consolidated financial statements. You should read this information in conjunction with our consolidated financial statements and related notes included elsewhere in this report.
|
As of and for the Year Ended December 31,
|
||||||||||||||||||||
|
(Dollars in thousands, except per share data)
|
2021
|
2020
|
2019
|
2018
|
2017
|
|||||||||||||||
|
Financial Condition
|
||||||||||||||||||||
|
Total assets
|
$
|
2,928,751
|
$
|
2,642,026
|
$
|
2,068,770
|
$
|
1,975,124
|
$
|
1,890,232
|
||||||||||
|
Securities
|
553,066
|
316,300
|
307,969
|
297,320
|
306,547
|
|||||||||||||||
|
Loans
|
1,108,993
|
1,429,331
|
1,385,627
|
1,405,658
|
1,320,309
|
|||||||||||||||
|
Deposits
|
2,577,958
|
2,298,587
|
1,753,294
|
1,676,739
|
1,579,010
|
|||||||||||||||
|
Long-term debt
|
—
|
20,619
|
20,619
|
41,238
|
41,238
|
|||||||||||||||
|
Other borrowed funds
|
85,000
|
70,000
|
60,000
|
60,000
|
92,118
|
|||||||||||||||
|
Shareholders' equity
|
254,005
|
239,843
|
217,469
|
190,853
|
172,986
|
|||||||||||||||
|
Share Information*
|
||||||||||||||||||||
|
Basic earnings (loss) per common share
|
$
|
0.85
|
$
|
0.88
|
$
|
0.94
|
$
|
0.78
|
$
|
0.48
|
||||||||||
|
Diluted earnings (loss) per common share
|
0.85
|
0.88
|
0.94
|
0.78
|
0.48
|
|||||||||||||||
|
Book value per common share
|
7.41
|
7.01
|
6.38
|
5.61
|
5.09
|
|||||||||||||||
|
Dividends per common share
|
0.32
|
0.32
|
0.28
|
0.25
|
0.18
|
|||||||||||||||
|
Dividend payout ratio
|
37.65
|
%
|
36.36
|
%
|
29.79
|
%
|
32.05
|
%
|
37.50
|
%
|
||||||||||
|
Average dilutive common shares outstanding
|
34,202,179
|
34,120,275
|
34,056,200
|
34,018,554
|
33,952,872
|
|||||||||||||||
|
Common shares outstanding at period end
|
34,259,945
|
34,197,519
|
34,103,542
|
34,045,411
|
33,972,977
|
|||||||||||||||
|
Operations
|
||||||||||||||||||||
|
Interest income
|
$
|
58,634
|
$
|
67,224
|
$
|
75,942
|
$
|
69,037
|
$
|
57,676
|
||||||||||
|
Interest expense
|
2,565
|
5,687
|
12,455
|
9,411
|
5,732
|
|||||||||||||||
|
Net interest income
|
56,069
|
61,537
|
63,487
|
59,626
|
51,944
|
|||||||||||||||
|
Provision for loan losses
|
(2,050
|
)
|
3,000
|
(450
|
)
|
450
|
(1,350
|
)
|
||||||||||||
|
Net interest income after provision for loan losses
|
58,119
|
58,537
|
63,937
|
59,176
|
53,294
|
|||||||||||||||
|
Total noninterest income
|
23,695
|
23,976
|
19,728
|
17,503
|
17,419
|
|||||||||||||||
|
Total noninterest expense
|
46,090
|
45,725
|
44,224
|
44,329
|
43,688
|
|||||||||||||||
|
Income before income tax
|
35,724
|
36,788
|
39,441
|
32,350
|
27,025
|
|||||||||||||||
|
Federal income tax**
|
6,710
|
6,623
|
7,462
|
5,971
|
10,733
|
|||||||||||||||
|
Net income attributable to common shares
|
29,014
|
30,165
|
31,979
|
26,379
|
16,292
|
|||||||||||||||
|
Performance Ratios
|
||||||||||||||||||||
|
Return on average equity
|
11.74
|
%
|
13.19
|
%
|
15.66
|
%
|
14.69
|
%
|
9.60
|
%
|
||||||||||
|
Return on average assets
|
1.02
|
1.27
|
1.59
|
1.40
|
0.93
|
|||||||||||||||
|
Yield on average interest-earning assets
|
2.19
|
3.00
|
4.04
|
3.91
|
3.59
|
|||||||||||||||
|
Cost on average interest-bearing liabilities
|
0.15
|
0.38
|
0.94
|
0.76
|
0.51
|
|||||||||||||||
|
Average net interest spread
|
2.04
|
2.62
|
3.10
|
3.15
|
3.08
|
|||||||||||||||
|
Average net interest margin
|
2.09
|
2.75
|
3.38
|
3.38
|
3.24
|
|||||||||||||||
|
Efficiency ratio
|
57.78
|
53.47
|
53.14
|
57.47
|
62.98
|
|||||||||||||||
|
Capital Ratios
|
||||||||||||||||||||
|
Period-end equity to total assets
|
8.67
|
%
|
9.08
|
%
|
10.51
|
%
|
9.66
|
%
|
9.15
|
%
|
||||||||||
|
Average equity to average assets
|
8.71
|
9.62
|
10.17
|
9.51
|
9.69
|
|||||||||||||||
|
Total risk-based capital ratio (consolidated)
|
18.32
|
18.29
|
15.78
|
15.54
|
14.99
|
|||||||||||||||
|
Credit Quality Ratios
|
||||||||||||||||||||
|
Allowance for loan losses to total loans
|
1.43
|
%
|
1.22
|
%
|
1.24
|
%
|
1.20
|
%
|
1.26
|
%
|
||||||||||
|
Nonperforming assets to total assets
|
0.08
|
0.12
|
0.14
|
0.24
|
0.33
|
|||||||||||||||
|
Nonaccrual loans to total loans
|
0.01
|
0.04
|
0.01
|
0.09
|
0.03
|
|||||||||||||||
|
Allowance for loan losses to nonaccrual loans
|
17,270.65
|
3,266.04
|
8,472.91
|
1,293.18
|
4,202.53
|
|||||||||||||||
|
Net charge-offs / (recoveries) to average loans
|
(0.04
|
)
|
0.19
|
(0.06
|
)
|
0.01
|
(0.08
|
)
|
||||||||||||
*Retroactively adjusted to reflect the effect of all stock splits and dividends
**2017 reflects the effect of "H.R.1", also known as the "Tax Cuts and Jobs Act", on the value of the Company's net deferred tax assets which increased federal income tax expense by
$2,524,000. 2021, 2020, 2019 and 2018 reflect the effect of the reduced corporate tax rate from 35% to 21% under H.R.1 effective as of January 1, 2018.
Management’s discussion and analysis of results of operations and financial condition contains forward-looking statements. Please refer to the discussion of forward-looking statements at the
beginning of this report.
The following section presents additional information to assess our results of operations and financial condition. This section should be read in conjunction with the consolidated financial
statements and the supplemental financial data contained elsewhere in this report.
The information under Item 1 – Business of this report is incorporated here by reference.
RESULTS OF OPERATIONS
Summary: Net income was $29.0
million ($35.7 million on a pretax basis) for 2021, compared to $30.2 million ($36.8 million on a pretax basis) for 2020. Earnings per common share on a diluted basis were $0.85 for 2021 and $0.88 for 2020.
Over the past several years, the improvement in our earnings has been the result of growth in revenue while expenses have been stable. The pandemic and related economic programs impacted this
dynamic. We recognized a significant amount of fee income from PPP loans in 2021 and 2020, while net interest income was negatively impacted by a very low interest rate environment and our customers holding historically high deposit balances at
the Bank. The decrease in revenue in 2021 compared to 2020 was due primarily to a reduction in net interest income and a lower level of gains on sales of mortgage loans. Our operating expenses were relatively flat from 2020 to 2021. Net
interest income decreased to $56.1 million in 2021 compared to $61.5 million in 2020. Gains on sales of mortgage loans were $4.7 million in 2021 compared to $6.5 million in 2020. Other categories of noninterest income were up $1.5 million in
2021, mostly offsetting the impact of lower gains on mortgage sales. Total noninterest expense was $46.1 million in 2021 compared to $45.7 million in 2020.
We recorded a provision for loan losses benefit of $2.1 million in 2021 and a provision for loan losses expense of $3.0 million in 2020. The provision taken in 2020 was driven by a $4.1
million charge-off taken in the second quarter of 2020 related to a single loan relationship with a movie theater business where the underlying assets were sold through bankruptcy proceedings. The 2020 provision also included additional
allocations provided to the portfolio for qualitative factors related to the COVID-19 pandemic. The provisions, particularly in 2021, were favorably impacted by low levels of nonperforming loans, strong asset quality and the levels of net loan
charge-offs to recoveries realized in recent periods. These items are discussed more fully below.
Net Interest Income: Net interest
income totaled $56.1 million during 2021 compared to $61.5 million during 2020.
The decrease in net interest income during 2021 compared to 2020 was due primarily to a reduction in yields on earning assets, particularly overnight deposits as the federal funds rate was
decreased by 150 basis points in March 2020 in response to the COVID-19 pandemic and maintained at near zero levels throughout 2021. Average yields on securities, interest earning assets and net interest margin are presented on a fully taxable
equivalent basis. Our net interest income as a percentage of average interest-earning assets (i.e. "net interest margin" or "margin") was 2.09% for the year ended December 31, 2021 and 2.75% for the year ended December 31, 2020.
The yield on earning assets decreased 81 basis points from 3.00% for 2020 to 2.19% for 2021. The decrease from 2020 to 2021 was generally due to an increase of $644.6 million in average
federal funds sold while the average short-term interest rates earned on these deposits remained near zero throughout 2021. Our margin in recent years has been negatively impacted by our decision to hold significant balances in liquid and
short-term investments.
Net interest income for 2021 decreased $5.5 million compared to 2020. Of this decrease, $6.7 million was due to changes in the volume of average interest earning assets and interest bearing
liabilities, partially offset by an increase of $1.2 million from changes in rates earned or paid. The largest changes came in commercial loan interest income which decreased by $5.1 million in 2021. Of the $5.1 million decrease in interest
income on commercial loans, $6.8 million was due to decreases in average balances, driven by forgiveness of PPP loans, partially offset by $1.7 million due to increases in rates earned from accelerated amortization of PPP fees upon forgiveness.
Average interest earning assets totaled $2.70 billion for 2021 compared to $2.25 billion in 2020. Increases of $644.6 million in average short-term investment balances partially offset by
$240.5 million in decreases in average loan balances from 2020 to 2021 were the primary drivers of the increase in total average interest earning assets. Yield on commercial loans (excluding PPP loans) decreased from 4.01% in 2020 to 3.72% in
2021. Yield on PPP loans was 5.79% in 2021 and 3.32% in 2020. The yield on PPP loans for 2021 was elevated as remaining deferred fees are recognized upon forgiveness. Yield on residential mortgage loans decreased from 3.66% in 2020 to 3.41% in
2021, while yield on consumer loans decreased from 4.32% in 2020 to 4.05% in 2021. The decreases in yields on commercial loans and consumer loans, in particular, were the result of the predominance of loans in these categories with variable
rates of interest tied to prime and LIBOR which decreased significantly in 2020 and remained low throughout 2021.
Our net interest margin for 2021 was positively impacted from a 23 basis point decrease in our cost of funds from 0.38% for 2020 to 0.15% for 2021. Average interest bearing liabilities
increased from $1.47 billion in 2020 to $1.69 billion in 2021. Decreases in the rates paid on certain deposit account types in response to market rate declines were the primary cause of the decrease in our cost of funds. Also impacting cost of
funds for 2021 was the redemption of the remaining $20.0 million trust preferred securities on July 7, 2021. While our funding costs have decreased, the yields on our interest earning assets decreased to a larger extent, causing net interest
income and net interest margin to decrease from 2020 to 2021.
In 2022, we expect that net interest margin will continue to be pressured by our higher levels of short-term investment balances. However, potentially offsetting this dynamic is the
asset-sensitive profile of our balance sheet which should cause improvement in net interest income should market interest rates rise.
The following table shows an analysis of net interest margin for the years ended December 31, 2021 and 2020 (dollars in thousands).
|
For the years ended December 31,
|
||||||||||||||||||||||||
|
2021
|
2020
|
|||||||||||||||||||||||
|
Average
Balance
|
Interest
Earned
or Paid
|
Average
Yield
or Cost
|
Average
Balance
|
Interest
Earned
or Paid
|
Average
Yield
or Cost
|
|||||||||||||||||||
|
Assets
|
||||||||||||||||||||||||
|
Taxable securities
|
$
|
210,513
|
$
|
3,283
|
1.56
|
%
|
$
|
184,089
|
$
|
3,700
|
2.01
|
%
|
||||||||||||
|
Tax-exempt securities (1)
|
152,459
|
3,056
|
2.58
|
131,992
|
3,412
|
3.33
|
||||||||||||||||||
|
Commercial loans (2)
|
898,257
|
42,168
|
3.72
|
1,015,946
|
41,289
|
4.01
|
||||||||||||||||||
|
PPP loans (3)
|
170,410
|
1,707
|
5.79
|
228,047
|
7,681
|
3.32
|
||||||||||||||||||
|
Residential mortgage loans
|
132,472
|
4,521
|
3.41
|
183,715
|
6,728
|
3.66
|
||||||||||||||||||
|
Consumer loans
|
55,940
|
2,268
|
4.05
|
69,854
|
3,019
|
4.32
|
||||||||||||||||||
|
Federal Home Loan Bank stock
|
11,558
|
211
|
1.80
|
11,558
|
427
|
3.63
|
||||||||||||||||||
|
Federal funds sold and other short-term investments
|
1,067,237
|
1,420
|
0.13
|
422,649
|
968
|
0.23
|
||||||||||||||||||
|
Total interest earning assets (1)
|
2,698,846
|
58,634
|
2.19
|
2,247,850
|
67,224
|
3.00
|
||||||||||||||||||
|
Noninterest earning assets:
|
||||||||||||||||||||||||
|
Cash and due from banks
|
34,740
|
30,917
|
||||||||||||||||||||||
|
Other
|
103,041
|
97,756
|
||||||||||||||||||||||
|
Total assets
|
$
|
2,836,627
|
$
|
2,376,523
|
||||||||||||||||||||
|
Liabilities
|
||||||||||||||||||||||||
|
Deposits:
|
||||||||||||||||||||||||
|
Interest bearing demand
|
$
|
681,411
|
$
|
166
|
0.03
|
%
|
$
|
535,922
|
$
|
409
|
0.08
|
%
|
||||||||||||
|
Savings and money
market accounts
|
822,235
|
246
|
0.03
|
715,135
|
1,110
|
0.16
|
||||||||||||||||||
|
Time deposits
|
101,353
|
503
|
0.49
|
134,199
|
1,969
|
1.47
|
||||||||||||||||||
|
Borrowings:
|
||||||||||||||||||||||||
|
Other borrowed funds
|
74,246
|
1,331
|
1.77
|
69,017
|
1,429
|
2.04
|
||||||||||||||||||
|
Long-term debt
|
10,564
|
319
|
2.98
|
20,619
|
770
|
3.67
|
||||||||||||||||||
|
Total interest bearing liabilities
|
1,689,809
|
2,565
|
0.15
|
1,474,892
|
5,687
|
0.38
|
||||||||||||||||||
|
Noninterest bearing liabilities:
|
||||||||||||||||||||||||
|
Noninterest bearing demand accounts
|
885,838
|
659,387
|
||||||||||||||||||||||
|
Other noninterest bearing liabilities
|
13,905
|
13,551
|
||||||||||||||||||||||
|
Shareholders' equity
|
247,075
|
228,693
|
||||||||||||||||||||||
|
Total liabilities and shareholders' equity
|
$
|
2,836,627
|
$
|
2,376,523
|
||||||||||||||||||||
|
Net interest income
|
$
|
56,069
|
$
|
61,537
|
||||||||||||||||||||
|
Net interest spread (1)
|
2.04
|
%
|
2.62
|
%
|
||||||||||||||||||||
|
Net interest margin (1)
|
2.09
|
%
|
2.75
|
%
|
||||||||||||||||||||
|
Ratio of average interest earning assets to average interest bearing liabilities
|
159.71
|
%
|
152.41
|
%
|
||||||||||||||||||||
| (1) |
Yields are presented on a tax equivalent basis using a 21% tax rate.
|
| (2) |
Loan fees of $1.1 million and $852,000 for 2021 and 2020, respectively, are included in interest income. Includes average nonaccrual loans of approximately $431,000 and $2.2 million for 2021 and 2020,
respectively. Excludes PPP loans.
|
| (3) |
Includes loan fees of $8.3 million and $5.4 million for the twelve months ended December 31, 2021 and 2020, respectively.
|
The following table presents the dollar amount of changes in net interest income due to changes in volume and rate.
|
For the years ended December 31,
|
||||||||||||
|
2021 vs 2020
Increase (Decrease) Due to
|
||||||||||||
|
Volume
|
Rate
|
Total
|
||||||||||
|
(Dollars in thousands)
|
||||||||||||
|
Interest income
|
||||||||||||
|
Taxable securities
|
$
|
485
|
$
|
(902
|
)
|
$
|
(417
|
)
|
||||
|
Tax-exempt securities
|
658
|
(1,014
|
)
|
(356
|
)
|
|||||||
|
Commercial loans, excluding PPP loans
|
(4,571
|
)
|
(2,842
|
)
|
(7,413
|
)
|
||||||
|
PPP loans
|
(2,268
|
)
|
4,586
|
2,318
|
||||||||
|
Residential mortgage loans
|
(1,774
|
)
|
(433
|
)
|
(2,207
|
)
|
||||||
|
Consumer loans
|
(573
|
)
|
(178
|
)
|
(751
|
)
|
||||||
|
Federal Home Loan Bank stock
|
—
|
(216
|
)
|
(216
|
)
|
|||||||
|
Federal funds sold and other short-term investments
|
974
|
(522
|
)
|
452
|
||||||||
|
Total interest income
|
(7,069
|
)
|
(1,521
|
)
|
(8,590
|
)
|
||||||
|
Interest expense
|
||||||||||||
|
Interest bearing demand
|
$
|
89
|
$
|
(332
|
)
|
$
|
(243
|
)
|
||||
|
Savings and money market accounts
|
145
|
(1,009
|
)
|
(864
|
)
|
|||||||
|
Time deposits
|
(396
|
)
|
(1,070
|
)
|
(1,466
|
)
|
||||||
|
Other borrowed funds
|
101
|
(199
|
)
|
(98
|
)
|
|||||||
|
Long-term debt
|
(324
|
)
|
(127
|
)
|
(451
|
)
|
||||||
|
Total interest expense
|
(385
|
)
|
(2,737
|
)
|
(3,122
|
)
|
||||||
|
Net interest income
|
$
|
(6,684
|
)
|
$
|
1,216
|
$
|
(5,468
|
)
|
||||
Provision for Loan Losses: The
provision for loan losses for 2021 was a benefit of $2.1 million compared to expense of $3.0 million for 2020. The provision for loan losses for 2020 was impacted by additional qualitative adjustments made to provide for estimated losses
associated with the COVID-19 pandemic as well as a $4.1 million charge-off taken in June 2020 related to a single loan relationship with a movie theater business for which the underlying assets were sold through bankruptcy proceedings. No
other loans of this industry type remain in our portfolio. This was partially offset by continued strong asset quality metrics and loan portfolio contraction. In 2021, economic conditions improved allowing for a partial reduction in the
additional qualitative adjustments made in 2020. This contributed to the level of the benefit recorded in 2021. In addition, specific reserves on impaired loans decreased by $646,000 from $1.2 million at December 31, 2020 to $565,000 at
December 31, 2021. When excluding PPP loans, which are 100% guaranteed by the SBA, total loans decreased by $133.2 million from December 31, 2020 to December 31, 2021. Net loan recoveries were $531,000 in 2021 compared to net loan chargeoffs
of $2.8 million in 2020.
Our overall weighted average commercial loan grade has been below 4.00 for the past several years. Our weighted average commercial loan grade was 3.60 at December 31, 2021 and 3.71 at December
31, 2020.
The amounts of loan loss provision in each period were the result of establishing our allowance for loan losses at levels believed necessary based upon our methodology for determining the
adequacy of the allowance. The sustained level of net recoveries over the past several years has had a significant effect on the historical loss component of our methodology. More information about our allowance for loan losses and our
methodology for establishing its level may be found in this Item 7 of this report under the heading “Allowance for Loan Losses” below and in Item 8 of this report in Note 3 of the Consolidated Financial Statements.
Noninterest Income: Noninterest
income totaled $23.7 million in 2021 compared to $24.0 million in 2020. The components of noninterest income are shown in the table below (in thousands):
|
2021
|
2020
|
|||||||
|
Service charges and fees on deposit accounts
|
$
|
4,446
|
$
|
4,030
|
||||
|
Net gains on mortgage loans
|
4,691
|
6,477
|
||||||
|
Trust fees
|
4,331
|
3,758
|
||||||
|
ATM and debit card fees
|
6,505
|
5,699
|
||||||
|
Bank owned life insurance (“BOLI”) income
|
1,033
|
874
|
||||||
|
Investment services fees
|
1,505
|
1,535
|
||||||
|
Other income
|
1,184
|
1,603
|
||||||
|
Total noninterest income
|
$
|
23,695
|
$
|
23,976
|
||||
Net gains on sales of mortgage loans decreased $1.8 million from 2020 to 2021 due to higher sales volumes in 2020. Net gains on mortgage loans included gains on the sale of real estate
mortgage loans in the secondary market. We sell the majority of the fixed-rate mortgage loans we originate. We do not retain the servicing rights for the loans we sell.
A summary of gain on sales of loans and related loan volume was as follows (in thousands):
|
For the Year Ended December 31,
|
||||||||
|
2021
|
2020
|
|||||||
|
Gain on sales of loans
|
$
|
4,691
|
$
|
6,477
|
||||
|
Real estate mortgage loans originated for sale
|
$
|
124,287
|
$
|
156,410
|
||||
|
Real estate mortgage loans sold
|
132,993
|
160,759
|
||||||
|
Net gain on the sale of mortgage loans as a percent of real estate mortgage loans sold ("Loan sale margin")
|
3.53
|
%
|
4.03
|
%
|
||||
As demonstrated in the table above, volume of mortgage loans originated for sale, while elevated, was down in 2021 compared to 2020. The low rate environment in the past two years has
significantly impacted mortgage sale production volume. As long-term market interest rates impacting mortgage rates began to rise in the latter half of 2021, mortgage production slowed and resulting gains declined.
Deposit service charges were up $416,000, primarily driven by growth in treasury management fee income charged to our commercial customers and, to a lesser extent, growth in overdraft fee
income. The improvement in treasury management fee income was a result of success in growing the number of business and municipal customers using these services in the last two years. Overdraft fees are driven by customer spending behavior and
this activity tracked with the overall effect of government shutdowns on the economy, particularly in the second quarter of 2020, which was most impacted by the COVID-19 response. The stimulus checks sent by the federal government also helped
our customers keep their accounts from overdrawing. As the economy began to normalize and customers used the economic impact payments, customer spending behavior began to return to normal.
Trust service revenue increased $573,000 in 2021. This increase was due partially to improvements in market valuations of assets on which fees are assessed, but also due to success in growing
our customer base in both personal trust and retirement plan services.
ATM and debit card processing income increased $806,000 in 2021 to $6.5 million compared to $5.7 million in 2020. This increase reflected an increase in usage from customers compared to 2020
when COVID-19 restrictions were implemented. By the end of 2020 and throughout 2021, the volume had rebounded to above average levels reflecting customer preference for this payment alternative. There was overall growth in the number of debit
and ATM card customers and promotional efforts to increase volume in these low cost transaction alternatives continue to be successful.
We did not sell any securities in 2021 or 2020. We continually review our securities portfolio and will dispose of securities that pose higher than desired credit or market risk, or as
warranted from overall portfolio maintenance or asset-liability management.
Investment services fees decreased $30,000 in 2021. The fees in 2020 were elevated due to the sale of a business by one of our customers with proceeds being invested in an annuity.
Earnings from bank owned life insurance increased by $159,000 in 2021 compared to 2020 due to the general performance of the underlying investments and the purchase of an additional $10.0
million of bank owned life insurance in the second quarter of 2021.
Other income, excluding investment services, was down by $419,000 in 2021 due largely to fees collected on customer back-to-back interest rate swaps. These fees were $8,000 in 2021 compared to
$420,000 in 2020.
Noninterest Expense: Noninterest
expense was $46.1 million in 2021 and $45.7 million in 2020. The slight increase in total noninterest expense reflected our active management of controllable costs. The components of noninterest expense are shown in the table below (in
thousands):
|
2021
|
2020
|
|||||||
|
Salaries and benefits
|
$
|
25,216
|
$
|
25,530
|
||||
|
Occupancy of premises
|
3,986
|
3,955
|
||||||
|
Furniture and equipment
|
3,940
|
3,678
|
||||||
|
Legal and professional
|
1,042
|
1,104
|
||||||
|
Marketing and promotion
|
723
|
891
|
||||||
|
Data processing
|
3,456
|
3,357
|
||||||
|
FDIC assessment
|
749
|
400
|
||||||
|
Interchange and other card expense
|
1,517
|
1,406
|
||||||
|
Bond and D&O insurance
|
448
|
418
|
||||||
|
Net losses on repossessed and foreclosed properties
|
23
|
19
|
||||||
|
Administration and disposition of problem assets
|
22
|
96
|
||||||
|
Outside services
|
1,922
|
1,792
|
||||||
|
Other noninterest expense
|
3,046
|
3,079
|
||||||
|
Total noninterest expense
|
$
|
46,090
|
$
|
45,725
|
||||
Salaries and benefits expense was the largest component of noninterest expense and was $25.2 million in 2021 and $25.5 million in 2020. The decrease in 2021 was primarily driven by a decrease
in variable compensation tied to lower mortgage loan production in 2021, lower medical insurance costs resulting from lower claims experience in 2021 and lower 401k matching costs as we reduced our matching percentage for 2021 to 100% of the
first 2% of salary contributions. This was increased back to normal level beginning January 1, 2022 at 100% of the first 3% and 50% of the next 2% of salary contributions. The table below identifies the primary components of salaries and
benefits (in thousands):
|
2021
|
2020
|
|||||||
|
Salaries and other compensation
|
22,611
|
22,545
|
||||||
|
Salary deferral from commercial loans
|
(1,062
|
)
|
(1,159
|
)
|
||||
|
Bonus
|
1,121
|
1,067
|
||||||
|
Mortgage production - variable comp
|
1,049
|
1,202
|
||||||
|
401k matching contributions
|
412
|
628
|
||||||
|
Medical insurance costs
|
1,085
|
1,247
|
||||||
|
Total salaries and benefits
|
$
|
25,216
|
$
|
25,530
|
||||
Costs associated with nonperforming assets remained at low levels, totaling $45,000 in 2021 and $115,000 in 2020. These costs included legal costs, repossessed and foreclosed property
administration expense and losses (gains) on repossessed and foreclosed properties. Repossessed and foreclosed property administration expense included survey and appraisal, property maintenance and management and other disposition and carrying
costs. Net (gains) losses on repossessed and foreclosed properties included both net gains and losses on the sale of properties and unrealized losses from value declines for outstanding properties.
These costs are itemized in the following table (in thousands):
|
2021
|
2020
|
|||||||
|
Legal and professional – nonperforming assets
|
$
|
19
|
$
|
58
|
||||
|
Repossessed and foreclosed property administration
|
3
|
38
|
||||||
|
Net losses on repossessed and foreclosed properties
|
23
|
19
|
||||||
|
Total
|
$
|
45
|
$
|
115
|
||||
During 2021, we did not add any other real estate properties and sold $170,000 of other real estate and repossessed assets, allowing for another reduction in our year-end balance, bringing it
from $2.5 million at December 31, 2020 to $2.3 million at December 31, 2021. In 2020, we did not add any other real estate properties and sold $192,000 of other real estate.
FDIC assessment expense increased to $749,000 in 2021 compared to $400,000 in 2020 primarily due to our asset growth and assessment credits applied during 2020. Assessment credits of $266,000
were applied in 2019, leaving approximately $172,000 in assessment credits which were fully utilized in 2020. There were no assessment credits applied in 2021. Further discussion regarding the determination of FDIC assessments for the Bank may
be found in Item 1 of this report under the heading "Supervision and Regulation."
Occupancy expense increased by $31,000 in 2021 primarily due to an increase in snow removal and building maintenance, partially offset by depreciation of
our buildings. Furniture and equipment expense increased by $262,000 in 2021 primarily due to an increase in equipment service contracts and software, partially offset by a decrease in equipment repairs.
Data processing expenses were $3.5 million in 2021 and $3.4 million in 2020. Increases in data processing for our systems and card programs in 2021 and costs associated with our conversion to
a new online banking service in 2020 were the primary reasons for the increase in 2021.
Federal Income Tax Expense: We
recorded federal income tax expense of $6.7 million in 2021 and $6.6 million in 2020. Our effective tax rate was 18.78% for 2021 and 18.00% for 2020. In the fourth quarter of 2020, we received the final distribution of a partnership interest
we had acquired in a loan settlement. This removed the uncertainty regarding our realization of the related deferred tax asset and, as such, the $92,000 valuation allowance we had established at December 31, 2018 was reversed at December 31,
2020.
FINANCIAL CONDITION
Summary: Total assets were $2.93
billion at December 31, 2021, an increase of $286.7 million from $2.64 billion at December 31, 2020. This change reflected increases of $368.1 million in cash and cash equivalents, $179.2 million in securities available for sale, $57.5 million
in securities held to maturity, and $10.0 million in bank owned life insurance, offset by decreases of $320.3 million in our loan portfolio, $4.0 million in loans held for sale, $2.0 million in other assets, $1.5 million in accrued interest
receivable, $1.4 million in premises and equipment, and $193,000 in other real estate owned. Total deposits increased by $279.4 million and other borrowed funds and long-term debt were down by $5.6 million at December 31, 2021 compared to
December 31, 2020.
Total shareholders’ equity increased by $14.2 million from December 31, 2020 to December 31, 2021. Shareholders’ equity was increased by $29.0 million of net income in 2021, partially offset
by cash dividends of $10.9 million, or $0.32 per share. Shareholders’ equity also decreased by $4.5 million in 2021 as a result of a swing in accumulated other comprehensive income due to the effect of interest rate movement on the fair value of
our available for sale securities portfolio. As of December 31, 2021 and 2020, the Bank was categorized as “well capitalized” under applicable regulatory guidelines.
Cash and Cash Equivalents: Our
cash and cash equivalents, which include federal funds sold and short-term investments, were $1.15 billion at December 31, 2021 compared to $783.7 million at December 31, 2020. This $368.1 million increase was primarily the result of an inflow
of balances from our deposit customers due to federal stimulus distributions and our customers' uncertainty related to the COVID-19 pandemic.
Securities: Securities available
for sale ("AFS") were $416.1 million at December 31, 2021 compared to $236.8 million at December 31, 2020. The balance at December 31, 2021 primarily consisted of U.S. Treasury and agency securities, agency mortgage backed securities and
various municipal investments. The growth in securities AFS was the result of increased purchase activity to accelerate the strategic deployment of excess liquid funds caused by our robust deposit growth. Investment purchases were focused on
short-term high quality securities consistent with our existing portfolio. Our held to maturity ("HTM") portfolio increased from $79.5 million at December 31, 2020 to $137.0 million at December 31, 2021. Our HTM portfolio is comprised of
state aid notes and locally sourced municipal and commercial bonds. The commercial bond component of this category declined by $2.9 million in 2021. These bonds represent financing provided to some of our non-profit commercial customers who
qualified for borrowing on a tax-exempt basis. The municipal bond component of this category increased by $60.4 million as we seized opportunities to deploy excess liquid funds in local, high quality, private placement municipal bonds with
short durations.
Portfolio Loans and Asset Quality:
Total portfolio loans decreased by $320.3 million to $1.11 billion at December 31, 2021 compared to $1.43 billion at December 31, 2020. During 2021, our commercial portfolio decreased by $281.2 million, while our residential mortgage portfolio
decreased by $31.7 million and our consumer portfolio decreased by $7.4 million. The SBA created the Paycheck Protection Program to provide an efficient means to provide funding for small businesses to maintain payroll and operations during
the COVID-19 pandemic. We were an active participant in this program and originated a total of 1,738 loans totaling $346.7 million in 2020 and a total of 1,000 loans totaling $128.1 million in 2021. Borrowers who use the funds from their PPP
loans to maintain payroll and for certain fixed expenses such as rent, occupancy, etc. are eligible to have 100% of their loans forgiven by the SBA. Through December 31, 2020, we had received disbursement of $113.5 million from the SBA for
approved forgiveness applications. In 2021, we received disbursement of $318.4 million from the SBA for approved forgiveness applications, leaving $41.9 million in remaining balance of PPP loans at December 31, 2021, compared to $229.1 million
at December 31, 2020.
The volume of residential mortgage loans originated for sale in 2021 decreased compared to 2020 as mortgage interest rates began to rise in late 2021, slowing down refinancing activity.
Residential mortgage loans originated for sale were $124.3 million in 2021 compared to $156.4 million in 2020.
We experienced year over year decline in commercial loans in 2021 after experiencing growth in commercial loan balances for the previous three years. Commercial loans grew $16.0 million in
2019, $119.6 million in 2020 and decreased $281.2 million in 2021. As discussed previously, most of the growth in 2020 and decline in 2021 was attributable to PPP loan activity. We plan for measured, high quality loan portfolio growth in 2022.
Commercial and commercial real estate loans remained our largest loan segment and accounted for 84.4% of the total loan portfolio at December 31, 2021 and 85.2% at December 31, 2020.
Residential mortgage and consumer loans comprised 15.6% of total loans at December 31, 2021 and 14.8% at December 31, 2020.
A further breakdown of the composition of the loan portfolio is shown in the table below (in thousands):
|
December 31, 2021
|
December 31, 2020
|
|||||||||||||||
|
Balance
|
Percent of
Total Loans
|
Balance
|
Percent of
Total Loans
|
|||||||||||||
|
Commercial real estate: (1)
|
||||||||||||||||
|
Residential developed
|
$
|
4,862
|
0.4
|
%
|
$
|
8,549
|
0.6
|
%
|
||||||||
|
Unsecured to residential developers
|
5,000
|
0
|
—
|
—
|
||||||||||||
|
Vacant and unimproved
|
36,240
|
3.3
|
47,122
|
3.3
|
||||||||||||
|
Commercial development
|
171
|
—
|
857
|
—
|
||||||||||||
|
Residential improved
|
100,077
|
9.0
|
114,392
|
8.0
|
||||||||||||
|
Commercial improved
|
259,039
|
23.4
|
266,006
|
18.6
|
||||||||||||
|
Manufacturing and industrial
|
110,712
|
10.0
|
115,247
|
8.1
|
||||||||||||
|
Total commercial real estate
|
516,101
|
46.5
|
552,173
|
38.6
|
||||||||||||
|
Commercial and industrial, excluding PPP
|
378,318
|
34.1
|
436,331
|
30.5
|
||||||||||||
|
Paycheck Protection Program (PPP)
|
41,939
|
3.8
|
229,079
|
16.0
|
||||||||||||
|
Total commercial
|
936,358
|
84.4
|
1,217,583
|
85.2
|
||||||||||||
|
Consumer
|
||||||||||||||||
|
Residential mortgage
|
117,800
|
10.7
|
149,556
|
10.5
|
||||||||||||
|
Unsecured
|
210
|
—
|
161
|
—
|
||||||||||||
|
Home equity
|
51,269
|
4.6
|
57,975
|
4.0
|
||||||||||||
|
Other secured
|
3,356
|
0.3
|
4,056
|
0.3
|
||||||||||||
|
Total consumer
|
172,635
|
15.6
|
211,748
|
14.8
|
||||||||||||
|
Total loans
|
$
|
1,108,993
|
100.0
|
%
|
$
|
1,429,331
|
100.0
|
%
|
||||||||
| (1) |
Includes both owner occupied and non-owner occupied commercial real estate.
|
Commercial real estate loans decreased $36.1 million since December 31, 2020 and accounted for 46.5% of our total loan portfolio at year-end 2021 and consisted primarily of loans to business
owners and developers of owner and non-owner occupied commercial properties and loans to developers of single and multi-family residential properties. In the table above, we show our commercial real estate portfolio by loans secured by
residential and commercial real estate, and by stage of development. Improved loans are generally secured by properties that are under construction or completed and placed in use. Development loans are secured by properties that are in the
process of development or fully developed. Vacant and unimproved loans are secured by raw land for which development has not yet begun and agricultural land.
Our overall commercial and industrial loan portfolio, including PPP, decreased by $245.1 million to $420.3 million at December 31, 2021 and represented 37.9% of our total loan portfolio. As
discussed above, this decrease includes $187.1 million net reduction in outstanding balances on PPP loans, due to SBA forgiveness.
Our consumer residential mortgage loan portfolio, which also includes residential construction loans made to individual homeowners, comprised approximately 10.7% of portfolio loans at December
31, 2021 and 10.5% at December 31, 2020. We expect to continue to retain in our loan portfolio certain types of residential mortgage loans (primarily high quality, low loan to value, adjustable rate loans) in an effort to continue to diversify
our credit risk and deploy our excess liquidity. A large portion of our residential mortgage loan production continues to be sold on the secondary market with servicing released.
The volume of residential mortgage loans originated for sale during 2021 decreased from 2020 as interest rates increased in 2021 and demand for refinancings declined as many potential borrowers
have recently refinanced in the extended low interest rate environment. In addition, customer preference drove more production in loan product types we sell on the secondary market (i.e. fixed-rate long-term mortgages). As of December 31, 2021,
the Company had no repurchase demands or claims related to residential mortgage loans sold on the secondary market during the five-year period ended December 31, 2021.
Our portfolio of other consumer loans includes loans secured by personal property and home equity fixed term and line of credit loans. Consumer loans decreased by $7.4 million to $54.8 million
at December 31, 2021 from $62.2 million at December 31, 2020 primarily due to a decrease in home equity loans. Consumer loans comprised approximately 4.9% of our portfolio loans at December 31, 2021 and 4.3% at December 31, 2020.
The following table shows our loan origination activity for portfolio loans during 2021 and 2020, broken out by loan type and also shows average originated loan size (dollars in thousands):
|
Year ended December 31, 2021
|
Year ended December 31, 2020
|
|||||||||||||||||||||||
|
Portfolio
Originations
|
Percent of
Total
Originations
|
Average
Loan Size
|
Portfolio
Originations
|
Percent of
Total
Originations
|
Average
Loan Size
|
|||||||||||||||||||
|
Commercial real estate:
|
||||||||||||||||||||||||
|
Residential developed
|
$
|
7,620
|
1.4
|
%
|
$
|
423
|
$
|
3,664
|
0.5
|
%
|
$
|
193
|
||||||||||||
|
Unsecured to residential developers
|
—
|
—
|
—
|
170
|
—
|
170
|
||||||||||||||||||
|
Vacant and unimproved
|
18,762
|
3.3
|
1,173
|
23,956
|
3.3
|
2,178
|
||||||||||||||||||
|
Commercial development
|
—
|
—
|
—
|
—
|
—
|
—
|
||||||||||||||||||
|
Residential improved
|
101,492
|
17.9
|
634
|
58,633
|
8.0
|
381
|
||||||||||||||||||
|
Commercial improved
|
71,486
|
12.6
|
1,191
|
53,748
|
7.4
|
1,344
|
||||||||||||||||||
|
Manufacturing and industrial
|
25,827
|
4.6
|
922
|
21,110
|
2.9
|
571
|
||||||||||||||||||
|
Total commercial real estate
|
225,187
|
39.8
|
799
|
161,281
|
22.1
|
616
|
||||||||||||||||||
|
Commercial and industrial, excluding PPP
|
110,667
|
19.5
|
838
|
142,993
|
19.5
|
866
|
||||||||||||||||||
|
PPP loans
|
128,473
|
22.7
|
128
|
346,276
|
47.4
|
199
|
||||||||||||||||||
|
Total commercial
|
464,327
|
82.0
|
327
|
650,550
|
89.0
|
301
|
||||||||||||||||||
|
Consumer
|
||||||||||||||||||||||||
|
Residential mortgage
|
48,930
|
8.6
|
314
|
36,605
|
5.0
|
300
|
||||||||||||||||||
|
Unsecured
|
—
|
—
|
—
|
49
|
—
|
16
|
||||||||||||||||||
|
Home equity
|
51,270
|
9.1
|
125
|
42,088
|
5.8
|
118
|
||||||||||||||||||
|
Other secured
|
1,567
|
0.3
|
23
|
1,560
|
0.2
|
18
|
||||||||||||||||||
|
Total consumer
|
101,767
|
18.0
|
161
|
80,302
|
11.0
|
141
|
||||||||||||||||||
|
Total loans
|
$
|
566,094
|
100.0
|
%
|
275
|
$
|
730,852
|
100.0
|
%
|
268
|
||||||||||||||
The table above demonstrates that our loan origination activity in 2021 was lower than in 2020, but was significantly impacted by PPP loan originations in 2020. Excluding PPP, we had higher
loan originations in 2021 than 2020. We believe the increased origination activity (excluding PPP activity) is primarily the result of increased business activity occurring in our marketplace as uncertainty over economic conditions with the
COVID-19 pandemic subsides.
Our loan portfolio is reviewed regularly by our senior management, our loan officers, and an internal loan review team that is independent of our loan originators and credit administration. An
administrative loan committee consisting of senior management and seasoned lending and collections personnel meets monthly to manage our internal watch list and proactively manage high risk loans.
When reasonable doubt exists concerning collectability of interest or principal of one of our loans, the loan is placed in nonaccrual status. Any interest previously accrued but not collected
is reversed and charged against current earnings.
Nonperforming assets are comprised of nonperforming loans, foreclosed assets and repossessed assets. At December 31, 2021, nonperforming assets totaled $2.4 million compared to $3.1 million at
December 31, 2020. There were no additions to other real estate owned in 2021 or in 2020. Based on the loans currently in their redemption period, we expect there to be few additions to other real estate owned in 2022. Proceeds from sales of
foreclosed and repossessed properties were $170,000 in 2021, resulting in a net realized loss on sale of $20,000. Proceeds from sales of foreclosed properties were $192,000 in 2020 resulting in a net realized gain on sale of $13,000.
Nonperforming loans include loans on nonaccrual status and loans delinquent more than 90 days but still accruing. As of December 31, 2021, nonperforming loans totaled $92,000, or 0.01% of total
portfolio loans, compared to $533,000, or 0.04% of total portfolio loans, at December 31, 2020.
Nonperforming loans at December 31, 2021 consisted of $5,000 of commercial real estate loans secured by various types of non-residential real estate, $1,000 of commercial and industrial loans
and $86,000 of consumer and residential mortgage loans.
Foreclosed and repossessed assets include assets acquired in settlement of loans. Foreclosed assets totaled $2.3 million at December 31, 2021 and $2.5 million at December 31, 2020. Of this
balance at December 31, 2021, there was 1 commercial real estate property totaling approximately $2.3 million. All properties acquired through or in lieu of foreclosure are initially transferred at their fair value less estimated costs to sell
and then evaluated monthly for impairment after transfer using a lower of cost or market approach. Updated property valuations are obtained at least annually on all foreclosed assets.
At December 31, 2021, our foreclosed asset portfolio had a weighted average age held in portfolio of 9.77 years. Below is a breakout of our foreclosed asset portfolio at December 31, 2021 and
2020 by property type and the percentages the property has been written down since taken into our possession and the combined writedown percentage, including losses taken when the property was loan collateral (dollars in thousands):
|
December 31, 2021
|
December 31, 2020
|
|||||||||||||||||||||||
|
Foreclosed Asset Property Type
|
Carrying
Value
|
Foreclosed
Asset
Writedown
|
Combined
Writedown
(Loan and
Foreclosed
Asset)
|
Carrying
Value
|
Foreclosed
Asset
Writedown
|
Combined
Writedown
(Loan and
Foreclosed
Asset)
|
||||||||||||||||||
|
Single Family
|
$
|
—
|
—
|
%
|
—
|
%
|
$
|
—
|
—
|
%
|
—
|
%
|
||||||||||||
|
Residential Lot
|
—
|
—
|
—
|
—
|
—
|
—
|
||||||||||||||||||
|
Multi-Family
|
—
|
—
|
—
|
—
|
—
|
—
|
||||||||||||||||||
|
Vacant Land
|
—
|
—
|
—
|
67
|
72.0
|
78.2
|
||||||||||||||||||
|
Residential Development
|
—
|
—
|
—
|
127
|
15.3
|
49.4
|
||||||||||||||||||
|
Commercial Office
|
—
|
—
|
—
|
—
|
—
|
—
|
||||||||||||||||||
|
Commercial Industrial
|
—
|
—
|
—
|
—
|
—
|
—
|
||||||||||||||||||
|
Commercial Improved
|
2,343
|
—
|
—
|
2,343
|
—
|
—
|
||||||||||||||||||
|
$
|
2,343
|
—
|
—
|
$
|
2,537
|
7.1
|
12.5
|
|||||||||||||||||
The following table shows the composition and amount of our nonperforming assets (dollars in thousands):
|
December 31,
|
||||||||||||||||||||
|
2021
|
2020
|
2019
|
2018
|
2017
|
||||||||||||||||
|
Nonaccrual loans
|
$
|
91
|
$
|
533
|
$
|
203
|
$
|
1,303
|
$
|
395
|
||||||||||
|
Loans 90 days or more delinquent and still accruing
|
1
|
—
|
—
|
1
|
—
|
|||||||||||||||
|
Total nonperforming loans (NPLs)
|
92
|
533
|
203
|
1,304
|
395
|
|||||||||||||||
|
Foreclosed assets
|
2,343
|
2,537
|
2,748
|
3,380
|
5,767
|
|||||||||||||||
|
Repossessed assets
|
—
|
—
|
—
|
—
|
11
|
|||||||||||||||
|
Total nonperforming assets (NPAs)
|
$
|
2,435
|
$
|
3,070
|
$
|
2,951
|
$
|
4,684
|
$
|
6,173
|
||||||||||
|
NPLs to total loans
|
0.01
|
%
|
0.04
|
%
|
0.01
|
%
|
0.09
|
%
|
0.03
|
%
|
||||||||||
|
NPAs to total assets
|
0.08
|
%
|
0.12
|
%
|
0.14
|
%
|
0.24
|
%
|
0.33
|
%
|
||||||||||
The following table shows the breakout of our troubled debt restructurings (“TDRs”) between performing and nonperforming at December 31, 2021 and 2020 (dollars in thousands):
|
December 31, 2021
|
December 31, 2020
|
|||||||||||||||||||||||
|
Commercial
|
Consumer
|
Total
|
Commercial
|
Consumer
|
Total
|
|||||||||||||||||||
|
Performing TDRs
|
$
|
4,497
|
$
|
3,024
|
$
|
7,521
|
$
|
4,959
|
$
|
4,049
|
$
|
9,008
|
||||||||||||
|
Nonperforming TDRs (1)
|
5
|
—
|
5
|
437
|
—
|
437
|
||||||||||||||||||
|
Total TDRs
|
$
|
4,502
|
$
|
3,024
|
$
|
7,526
|
$
|
5,396
|
$
|
4,049
|
$
|
9,445
|
||||||||||||
| (1) |
Included in nonperforming asset table above
|
The following table further shows the composition of our TDRs over the past five years (dollars in thousands):
|
December 31,
|
||||||||||||||||||||
|
2021
|
2020
|
2019
|
2018
|
2017
|
||||||||||||||||
|
Commercial and industrial TDRs
|
$
|
3,375
|
$
|
3,957
|
$
|
5,797
|
$
|
6,502
|
$
|
6,403
|
||||||||||
|
Commercial real estate TDRs
|
1,127
|
1,439
|
2,770
|
3,305
|
7,332
|
|||||||||||||||
|
Consumer TDRs
|
3,024
|
4,049
|
5,140
|
6,346
|
8,345
|
|||||||||||||||
|
Total TDRs
|
$
|
7,526
|
$
|
9,445
|
$
|
13,707
|
$
|
16,153
|
$
|
22,080
|
||||||||||
We had a total of $7.5 million and $9.4 million of loans whose terms have been modified in TDRs as of December 31, 2021 and 2020, respectively. These loans may have involved the restructuring
of terms to allow customers to mitigate the risk of foreclosure by meeting a lower loan payment requirement based upon their current cash flow. These may also include loans that renewed at existing contractual rates, but below market rates for
comparable credit. For each restructuring, a comprehensive credit underwriting analysis of the borrower’s financial condition and prospects of repayment under the revised terms is performed to assess whether the structure can be successful and
that cash flows will be sufficient to support the restructured debt. An analysis is also performed to determine whether the restructured loan should be on accrual status. Generally, if the loan is on accrual at the time of restructure, it will
remain on accrual after the restructuring. In some cases, a nonaccrual loan may be placed on accrual at restructuring if the loan’s actual payment history demonstrates it would have cash flowed under the restructured terms. After six
consecutive payments under the restructured terms, a nonaccrual restructured loan is reviewed for possible upgrade to accruing status. In situations where there is a subsequent modification or renewal and the loan is brought to market terms,
including a contractual interest rate not less than a market interest rate for new debt with similar credit risk characteristics, the TDR and impaired designations may be removed.
As with other impaired loans, an allowance for loan loss is estimated for each TDR based on the most likely source of repayment for each loan. For impaired commercial real estate loans that
are collateral dependent, the allowance is computed based on the fair value of the underlying collateral, less estimated costs to sell. For impaired commercial loans where repayment is expected from cash flows from business operations, the
allowance is computed based on a discounted cash flow computation. Certain groups of TDRs, such as residential mortgages, have common characteristics and for them the allowance is computed based on a discounted cash flow computation on the
change in weighted rate for the pool. The allowance allocations for commercial TDRs where we have reduced the contractual interest rate are computed by measuring cash flows using the new payment terms discounted at the original contractual rate.
In March 2020, guidance issued by the federal banking agencies in consultation with FASB and the Coronavirus Aid, Relief and Economic Security ("CARES") Act collectively specified that COVID-19
related modifications on loans that were not more than 30 days past due as of December 31, 2019 are not TDRs. Through December 31, 2021, the Bank had applied this guidance and modified 726 individual loans with aggregate principal balances
totaling $337.2 million. As of December 31, 2021, all of these modifications had expired and the loans were performing in accordance with their contractual payment terms.
Allowance for loan losses:
Determining the appropriate level of the allowance for loan losses is highly subjective. Timely identification of risk rating changes within the commercial loan portfolio is key to our process of establishing an appropriate allowance balance.
The internal risk rating system is discussed below.
The allowance for loan losses at December 31, 2021 was $15.9 million, a decrease of $1.5 million, compared to $17.4 million at December 31, 2020. The balance of the allowance for loan losses
was 1.43% of total portfolio loans at December 31, 2021 compared to 1.22% of total portfolio loans at December 31, 2020. The ratio at December 31, 2021 and 2020 was impacted by $41.9 million and $229.1 million of remaining PPP loans,
respectively. The ratio excluding these loans was 1.49% and 1.45% at December 31, 2021 and 2020. The allowance for loan losses to nonperforming loan coverage ratio remained high at 17,271% at December 31, 2021 compared to 3,266% at December 31,
2020.
The following is a summary of certain key ratios regarding allowance activity and coverage.
|
December 31
|
||||||||
|
2021
|
2020
|
|||||||
|
Ratios:
|
||||||||
|
Net charge-offs (recoveries) to average loans outstanding - Total
|
(0.04
|
)%
|
0.19
|
%
|
||||
|
Net charge-offs (recoveries) to average loans outstanding - Commercial Loans
|
(0.05
|
)%
|
0.23
|
%
|
||||
|
Net charge-offs (recoveries) to average loans outstanding - Residential Mortgage Loans
|
(0.01
|
)%
|
(-0.02
|
)%
|
||||
|
Net charge-offs (recoveries) to average loans outstanding - Consumer Loans
|
0.05
|
%
|
(-0.01
|
)%
|
||||
|
Nonaccrual loans to loans outstanding at year-end
|
0.01
|
%
|
0.04
|
%
|
||||
|
Allowance for loan losses to loans outstanding at year-end
|
1.43
|
%
|
1.22
|
%
|
||||
|
Allowance for loan losses to nonaccrual loans at year-end
|
17,640
|
%
|
3,266
|
%
|
||||
|
Allowance for loan losses to nonperforming loans at year-end
|
17,271
|
%
|
3,266
|
%
|
||||
The continued low level of net charge-offs over the last several years has had a significant effect on the historical loss component of our allowance for loan losses computation.
The table below shows the changes in these metrics over the past five years:
|
(Dollars in millions)
|
2021
|
2020
|
2019
|
2018
|
2017
|
|||||||||||||||
|
Commercial loans
|
$
|
936.4
|
$
|
1,217.6
|
$
|
1,098.0
|
$
|
1,082.1
|
$
|
1,007.1
|
||||||||||
|
Nonperforming loans
|
0.1
|
0.5
|
0.2
|
1.3
|
0.4
|
|||||||||||||||
|
Other real estate owned and repo assets
|
2.3
|
2.5
|
2.7
|
3.4
|
5.8
|
|||||||||||||||
|
Total nonperforming assets
|
2.4
|
3.0
|
3.0
|
4.7
|
6.2
|
|||||||||||||||
|
Net charge-offs (recoveries)
|
(0.5
|
)
|
2.8
|
(0.8
|
)
|
0.2
|
(1.0
|
)
|
||||||||||||
|
Total delinquencies
|
0.1
|
0.6
|
0.4
|
0.9
|
1.0
|
|||||||||||||||
Nonperforming loans have been low over the past several years. At December 31, 2021, we have had net loan recoveries in twenty-six of the past twenty-eight quarters. Perhaps even more
importantly, our total delinquencies 30 days and greater have continued to be minimal, and were just $129,000 at December 31, 2021.
The provision for loan losses was a benefit of $2.1 million for 2021 compared to an expense of $3.0 million for 2020. The provision in each period was impacted by the levels of nonperforming
loans and net charge-off/recovery experience. The 2020 provision was also impacted by a $4.1 million charge-off on a single commercial loan relationship. We had net recoveries in 2021 totaling $531,000 compared to net charge-offs of $2.8
million in 2020. The ratio of net charge-offs / (recoveries) to average loans was (0.04%) for 2021 compared to 0.19% for 2020.
Despite the unique charge-off we incurred in 2020, we are encouraged by the low level of charge-offs over the past several years. We do, however, recognize that future charge-offs and resulting
provisions for loan losses are expected to be impacted by the timing and extent of changes in the overall economy and the real estate markets.
Our allowance for loan losses is maintained at a level believed appropriate based upon our assessment of the probable estimated losses inherent in the loan portfolio. Our methodology for
measuring the appropriate level of allowance and related provision for loan losses relies on several key elements, which include specific allowances for loans considered impaired, general allowance for commercial loans not considered impaired
based upon applying our loan rating system, and general allocations based on historical trends for homogeneous loan groups with similar risk characteristics.
Impaired loans decreased $3.1 million, or 29%, to $7.5 million at December 31, 2021 compared to $10.6 million at December 31, 2020. The specific allowance for impaired loans decreased
$645,000 to $565,000, or 7.5% of total impaired loans, at December 31, 2021 compared to $1.2 million, or 11.4% of total impaired loans, at December 31, 2020.
Specific allowances are established on individually impaired credits where we believe it is probable that a loss may be incurred. Specific allowances are determined based on discounting
estimated cash flows over the life of the loan or based on the fair value of collateral supporting the loan. For commercial real estate loans, generally appraisals are used to estimate the fair value of the collateral and determine the
appropriate specific allowance. Estimated selling costs are also considered in the estimate. When it becomes apparent that liquidation of the collateral is the only source of repayment, the collateral shortfall is charged off rather than
carried as a specific allowance.
The general allowance (referred to as “formula allowance”) allocated to commercial loans that were not considered to be impaired was based upon the internal risk grade of such loans. We use a
loan rating method based upon an eight point system. Loans are stratified between real estate secured and non-real estate secured. The real estate secured portfolio is further stratified by the type of real estate. Each stratified portfolio is
assigned a loss allocation factor. Generally, a worse grade assigned to a loan category results in a greater allocation percentage. Changes in risk grade of loans affect the amount of the allowance allocation.
The determination of our loss factors is based upon our actual loss history by loan grade and adjusted for significant factors that, in management's judgment, affect the collectability of the
portfolio as of the analysis date. We use a rolling 18 month (6 quarter) actual net charge-off history as the base for our computation for commercial loans. The 18 month period ended December 31, 2021 reflected net recoveries for most of our
loan pools. We addressed this volatility in the qualitative factor considerations applied in our allowance computation. We also considered the extended period of improved asset quality in assessing the overall qualitative component.
We also have considered the effect of COVID-19 on our loan borrowers and our local economy. While significant stimulus and mitigation efforts were expected to soften the impact, we believed a
downgrade to our economic qualitative factor was appropriate and we added 7 basis points to this qualitative factor at March 31, 2020. Additional allocations were provided in the second, third and fourth quarters of 2020. In the first quarter of
2021, this factor was decreased by 2 basis points in recognition of improved economic conditions but additional allocations were made to other factors for a net increase of 8 basis points in the quarter. In the second quarter 2021, we added 20
basis points to our consumer loan portfolio qualitative factors to address the risk that economic impact payments may be masking consumer delinquency and default. We maintained these qualitative factors in the third and fourth quarters of 2021.
Reflecting improvement in our local economy, in the fourth quarter of 2021 we reduced the overall economic qualitative factor by 6 basis points.
Considering the change in our qualitative factors and changes in our commercial loan portfolio balances, the general commercial loan allowance decreased $821,000 to $12.9 million at December
31, 2021 compared to $13.8 million at December 31, 2020. The qualitative component of our allowance allocated to commercial loans was $12.9 million at December 31, 2021, down from $13.7 million at December 31, 2020.
Groups of homogeneous loans, such as residential real estate and open- and closed-end consumer loans, receive allowance allocations based on loan type. A rolling 12 month (4 quarter)
historical loss experience period was applied to residential mortgage and consumer loan portfolios. As with commercial loans that are not considered impaired, the determination of the allowance allocation percentage is based principally on our
historical loss experience. These allocations are adjusted for consideration of general economic and business conditions, credit quality and delinquency trends, collateral values, and recent loss experience for these similar pools of loans. The
homogeneous loan allowance was $2.4 million at December 31, 2021 compared to $2.4 million at December 31, 2020.
As noted above, the formula allowance allocated to commercial loans that are not considered to be impaired is calculated by applying historical loss factors to outstanding loans based on the
internal risk rating of such loans. We use a loan rating method based upon an eight point system. Loans rated a 4 or better are considered of acceptable risk. Loans rated a 5 exhibit above-normal risk to the Company and warrant a greater level
of attention by management. These loans are subject to on-going review and assessment by our Administrative Loan Committee. Loans rated a 6 or worse are considered substandard, doubtful or loss, exhibit a greater relative risk of loss to the
Company based upon the rating and warrant an active workout plan administered by our Special Asset Group.
The qualitative factors assessed and used to adjust historical loss experience reflect our assessment of the impact of economic trends, delinquency and other problem loan trends, trends in
valuations supporting underlying collateral, changes in loan portfolio concentrations, effect of changes in interest rates on loan collectability, competition and changes in internal credit administration practices have on probable losses
inherent in our loan portfolio. Qualitative adjustments are inherently subjective and there can be no assurance that these adjustments have properly identified probable losses in our loan portfolio. More information regarding the subjectivity
involved in determining the estimate of the allowance for loan losses may be found in this Item 7 of this report under the heading "Critical Accounting Policies and Estimates."
The following table shows the allocation of the allowance for loan losses by portfolio type at the dates indicated.
|
December 31,
|
||||||||||||||||
|
2021
|
2020
|
|||||||||||||||
|
(Dollars in thousands)
|
Allowance
Amount
|
% of
Each
Category
to Total
Loans
|
Allowance
Amount
|
% of
Each
Category
to Total
Loans
|
||||||||||||
|
Commercial and commercial real estate
|
$
|
13,256
|
84
|
%
|
$
|
14,650
|
85
|
%
|
||||||||
|
Residential mortgage
|
1,836
|
11
|
1,996
|
11
|
||||||||||||
|
Consumer
|
797
|
5
|
762
|
4
|
||||||||||||
|
Total
|
$
|
15,889
|
100
|
%
|
$
|
17,408
|
100
|
%
|
||||||||
The components of the allowance for loan losses were as follows:
|
December 31,
|
||||||||||||||||
|
2021
|
2020
|
|||||||||||||||
|
(Dollars in thousands)
|
Balance of
Loans
|
Allowance
Amount
|
Balance of
Loans
|
Allowance
Amount
|
||||||||||||
|
Commercial and commercial real estate:
|
||||||||||||||||
|
Impaired with allowance recorded
|
$
|
3,215
|
$
|
327
|
$
|
5,593
|
$
|
900
|
||||||||
|
Impaired with no allowance recorded
|
1,287
|
—
|
977
|
—
|
||||||||||||
|
Loss allocation factor on non-impaired loans
|
931,856
|
12,929
|
1,211,013
|
13,750
|
||||||||||||
|
936,358
|
13,256
|
1,217,583
|
14,650
|
|||||||||||||
|
Residential mortgage and consumer:
|
||||||||||||||||
|
Reserves on troubled debt restructurings
|
3,024
|
238
|
4,049
|
310
|
||||||||||||
|
Loss allocation factor
|
169,611
|
2,395
|
207,699
|
2,448
|
||||||||||||
|
Total
|
$
|
1,108,993
|
$
|
15,889
|
$
|
1,429,331
|
$
|
17,408
|
||||||||
With the exception of certain TDRs, impaired commercial loans at December 31, 2021 were classified as substandard or worse per our internal risk rating system. $2.7 million of residential
mortgage TDRs were associated with programs approved by the U.S. government during 2009 to minimize the number of consumer foreclosures. These loans involved the restructuring of terms on consumer mortgages to allow customers to mitigate
foreclosure by meeting a lower loan payment requirement based upon their current cash flow. Also included in this category are certain consumer home equity loans that were restructured maturing home equity lines of credit that did not qualify
for traditional term financing. We have been actively working with our customers to reduce the risk of foreclosure using these programs. Additional information regarding impaired loans at December 31, 2021 and 2020 may be found in Item 8 of
this report in Note 3 to the Consolidated Financial Statements.
Our weighted average loan grade was 3.67 at December 31, 2019, 3.71 at December 31, 2020 and 3.60 at December 31, 2021. The decrease of $1.4 million in reserves on commercial loans for 2021
was due to a $573,000 decrease in specific reserves on impaired loans and a $821,000 decrease in the loss allocation factor on non-impaired loans at December 31, 2021.
Of the $15.9 million allowance at December 31, 2021, 4% related to specific allocations on impaired loans, 81% related to formula allowance on commercial loans and 15% related to general
allocations for homogeneous loans. Of the $17.4 million allowance at December 31, 2020, 7% related to specific allocations on impaired loans, 79% related to formula allowance on commercial loans and 14% related to general allocations for
homogeneous loans. Of the $15.3 million total formula based allowance for loan loss allocations at December 31, 2021, $15.3 million is from general/environmental allocations and $70,000 was driven from historical experience. Of the $16.2
million total formula based allowance for loan loss allocations at December 31, 2020, $16.1 million is from general/environmental allocations and $56,000 is driven from historical experience. The above allocations are not intended to imply
limitations on usage of the allowance. The entire allowance is available for any loan losses without regard to loan type.
More information regarding steps to address the elevated levels of substandard, impaired and nonperforming loans may be found in this Item 7 of this report under the heading "Portfolio Loans
and Asset Quality" above and in Item 8 of this report in Note 3 to the Consolidated Financial Statements.
Certain industry sectors will be more negatively impacted than others by the economic effects of COVID-19 and governmental action. For example, businesses that thrive on large masses of people
assembling in close proximity, such as hospitality, restaurants and sporting events will likely incur longer lasting negative effects than other industries. We believe our commercial portfolio is adequately diversified, with our largest
commercial concentrations in Real Estate, Rental and Leasing (31%), followed by Manufacturing (14%) and Retail Trade (10%).
The table below breaks down our commercial loan portfolio by industry type at December 31, 2021 and identifies the percentage of loans in each type that have a pass rating within our grading
system (4 or better) and criticized rating (5 or worse) (dollars in thousands):
|
December 31, 2021
|
||||||||||||||||||||||||
|
Excluding PPP
|
PPP Loans
|
Total
|
Percent of
Total Loans
|
Percent Grade 4 or Better
|
Percent Grade 5 or Worse
|
|||||||||||||||||||
|
Industry:
|
||||||||||||||||||||||||
|
Agricultural Products
|
$
|
39,563
|
$
|
202
|
$
|
39,765
|
4.25
|
%
|
92.54
|
%
|
7.46
|
%
|
||||||||||||
|
Mining and Oil Extraction
|
1,232
|
—
|
1,232
|
0.13
|
%
|
94.07
|
%
|
5.93
|
%
|
|||||||||||||||
|
Utilities
|
—
|
—
|
—
|
0.00
|
%
|
0.00
|
%
|
0.00
|
%
|
|||||||||||||||
|
Construction
|
66,864
|
6,169
|
73,033
|
7.80
|
%
|
97.53
|
%
|
2.47
|
%
|
|||||||||||||||
|
Manufacturing
|
122,668
|
10,975
|
133,643
|
14.27
|
%
|
97.73
|
%
|
2.27
|
%
|
|||||||||||||||
|
Wholesale Trade
|
60,600
|
342
|
60,942
|
6.51
|
%
|
100.00
|
%
|
0.00
|
%
|
|||||||||||||||
|
Retail Trade
|
91,611
|
2,351
|
93,962
|
10.03
|
%
|
99.91
|
%
|
0.09
|
%
|
|||||||||||||||
|
Transportation and Warehousing
|
47,493
|
789
|
48,282
|
5.16
|
%
|
98.20
|
%
|
1.80
|
%
|
|||||||||||||||
|
Information
|
712
|
261
|
973
|
0.10
|
%
|
31.86
|
%
|
68.14
|
%
|
|||||||||||||||
|
Finance and Insurance
|
30,770
|
125
|
30,895
|
3.30
|
%
|
100.00
|
%
|
0.00
|
%
|
|||||||||||||||
|
Real Estate and Rental and Leasing
|
285,358
|
682
|
286,040
|
30.55
|
%
|
99.91
|
%
|
0.09
|
%
|
|||||||||||||||
|
Professional, Scientific and Technical Services
|
7,585
|
1,495
|
9,080
|
0.97
|
%
|
97.56
|
%
|
2.44
|
%
|
|||||||||||||||
|
Management of Companies and Enterprises
|
2,099
|
—
|
2,099
|
0.22
|
%
|
100.00
|
%
|
0.00
|
%
|
|||||||||||||||
|
Administrative and Support Services
|
16,201
|
1,510
|
17,711
|
1.89
|
%
|
99.42
|
%
|
0.58
|
%
|
|||||||||||||||
|
Education Services
|
2,939
|
352
|
3,291
|
0.35
|
%
|
97.42
|
%
|
2.58
|
%
|
|||||||||||||||
|
Health Care and Social Assistance
|
40,225
|
10,617
|
50,842
|
5.43
|
%
|
100.00
|
%
|
0.00
|
%
|
|||||||||||||||
|
Arts, Entertainment and Recreation
|
6,419
|
359
|
6,778
|
0.72
|
%
|
95.31
|
%
|
4.69
|
%
|
|||||||||||||||
|
Accommodations and Food Services
|
40,465
|
3,785
|
44,250
|
4.73
|
%
|
85.82
|
%
|
14.18
|
%
|
|||||||||||||||
|
Other Services
|
31,565
|
1,925
|
33,490
|
3.58
|
%
|
99.47
|
%
|
0.53
|
%
|
|||||||||||||||
|
Public Administration
|
—
|
—
|
—
|
0.00
|
%
|
0.00
|
%
|
0.00
|
%
|
|||||||||||||||
|
Private Households
|
50
|
—
|
50
|
0.01
|
%
|
100.00
|
%
|
0.00
|
%
|
|||||||||||||||
|
Total commercial loans
|
$
|
894,419
|
$
|
41,939
|
$
|
936,358
|
100.00
|
%
|
98.19
|
%
|
1.81
|
%
|
||||||||||||
Accommodations and Food Services in the table above includes our loans to restaurants and hotels. We have reviewed each relationship in this industry group and have determined based upon their
nature of operations and our loan structure that we believe our loss exposure is limited.
Although we believe our allowance for loan losses has captured the losses that are probable in our portfolio as of December 31, 2021, there can be no assurance that all losses have been
identified or that the allowance is sufficient.
Premises and Equipment: Premises
and equipment totaled $41.8 million at December 31, 2021 compared to $43.3 million at December 31, 2020 as capital additions were more than offset by depreciation of current facilities during 2021.
Bank owned life insurance (BOLI):
The Bank has purchased life insurance policies on certain officers. BOLI is recorded at its currently realizable cash surrender value and totaled $52.5 million at December 31, 2021 compared to $42.5 million at December 31, 2020. The Bank
purchased an additional $10.0 million of BOLI in the second quarter of 2021.
Deposits and Other Borrowings:
Total deposits increased $279.4 million to $2.58 billion at December 31, 2021, as compared to $2.30 billion at December 31, 2020. The majority of the increase in deposits in both 2020 and 2021 can be attributed to fiscal stimulus provided by
the federal government in response to the COVID-19 pandemic. The stimulus funds ultimately increased the deposit balances of our retail, commercial and municipal customers. Noninterest checking account balances increased $76.7 million in
2021. Interest bearing demand account balances increased $93.7 million and savings and money market account balances increased $122.8 million in 2021 while our certificates of deposits (primarily short-term) decreased by $13.8 million in
2021. We believe our success in maintaining and increasing the balances of personal and business checking and savings accounts was primarily attributable to our focus on quality customer service, the desire of customers to deal with a local
bank, the convenience of our branch network and the breadth and depth of our product line.
Noninterest bearing demand accounts comprised 34% of total deposits at December 31, 2021 compared to 35% of total deposits at December 31, 2020. Because of the generally low rates paid on
interest bearing account alternatives, many of our business customers chose to keep their balances in these more liquid noninterest bearing demand account types. Interest bearing demand, money market and savings accounts, comprised 62% of total
deposits at December 31, 2021 and 60% at December 31, 2020. Time accounts as a percentage of total deposits were 3% at December 31, 2021 and 5% at December 31, 2020.
Borrowed funds totaled $85.0 million at December 31, 2021 comprised of $85.0 million in Federal Home Loan Bank advances. Borrowed funds totaled $90.6 million at December 31, 2020 including
$70.0 million of Federal Home Loan Bank advances and $20.6 million in long-term debt associated with trust preferred securities. The $5.6 million decrease in borrowed funds in 2021 was due to the addition of a single $25.0 million putable
advance with the Federal Home Loan Bank executed in the third quarter 2021 after a $10 million advance maturity in the second quarter of 2021, partially offset by the redemption of our remaining trust preferred securities. The $25 million
advance carried an interest rate of just 0.01%. The FHLB exercised its put option and it was repaid as required on January 21, 2022.
At December 31, 2020, the Company had outstanding $20.0 million aggregate liquidation amount of pooled trust preferred securities (“TRUPs”) issued through its wholly-owned subsidiary grantor
trust, Macatawa Statutory Trust II (issued $20.0 million aggregate liquidation amount with a floating interest rate of three-month LIBOR plus 2.75%). On July 7, 2021, the Company redeemed all of the long-term debt associated with trust preferred
securities. At December 31, 2021, the Company had no remaining trust preferred securities outstanding.
Information regarding our off-balance sheet commitments may be found in Item 8 of this report in Note 17 to the Consolidated Financial Statements.
CAPITAL RESOURCES
Total shareholders’ equity increased by $14.2 million from December 31, 2020 to December 31, 2021. Shareholders’ equity was increased by $29.0 million of net income in 2021, partially offset
by cash dividends of $10.9 million, or $0.32 per share. Shareholders’ equity decreased by $4.5 million in 2021 as a result of a swing in accumulated other comprehensive income due to the effect of interest rate movement on the fair value of our
available for sale securities portfolio. As of December 31, 2021, the Bank was categorized as “well capitalized” under applicable regulatory guidelines.
Our regulatory capital ratios (on a consolidated basis) continue to significantly exceed the levels required to be categorized as “well capitalized” according to the requirements specified by
the rules implementing Basel III.
The following table shows our regulatory capital ratios (on a consolidated basis) for the past three years.
|
December 31,
|
||||||||||||
|
2021
|
2020
|
2019
|
||||||||||
|
Total capital to risk weighted assets
|
18.3
|
%
|
18.3
|
%
|
15.8
|
%
|
||||||
|
Common Equity Tier 1 to risk weighted assets
|
17.2
|
15.8
|
13.5
|
|||||||||
|
Tier 1 capital to risk weighted assets
|
17.2
|
17.1
|
14.7
|
|||||||||
|
Tier 1 capital to average assets
|
8.7
|
9.9
|
11.5
|
|||||||||
Our Board of Directors declared quarterly cash dividends to common shareholders beginning with the first quarter of 2014, and each subsequent quarter in 2014 through 2021. The declaration and
payment of future dividends to common shareholders will be considered by the Board of Directors in its discretion and will depend on a number of factors, including our financial condition and anticipated profitability.
Capital sources include, but are not limited to, additional private and public common stock offerings, preferred stock offerings and subordinated debt.
Macatawa Bank:
The Bank was categorized as "well capitalized" at December 31, 2021 and 2020 according to the requirements specified by the rules implementing Basel III. The following table shows the Bank’s
regulatory capital ratios for the past three years.
|
December 31,
|
||||||||||||
|
2021
|
2020
|
2019
|
||||||||||
|
Average equity to average assets
|
8.8
|
%
|
10.2
|
%
|
11.8
|
%
|
||||||
|
Total capital to risk weighted assets
|
17.8
|
17.8
|
15.3
|
|||||||||
|
Common Equity Tier 1 to risk weighted assets
|
16.7
|
16.7
|
14.3
|
|||||||||
|
Tier 1 capital to risk weighted assets
|
16.7
|
16.7
|
14.3
|
|||||||||
|
Tier 1 capital to average assets
|
8.4
|
9.6
|
11.2
|
|||||||||
LIQUIDITY
Liquidity of Macatawa Bank: The
liquidity of a financial institution reflects its ability to manage a variety of sources and uses of funds. Our Consolidated Statements of Cash Flows categorize these sources and uses into operating, investing and financing activities. We
primarily focus on developing access to a variety of borrowing sources to supplement our deposit gathering activities and provide funds for our investment and loan portfolios. Our sources of liquidity include our borrowing capacity with the
FRB's discount window, the Federal Home Loan Bank, federal funds purchased lines of credit and other secured borrowing sources with our correspondent banks, loan payments by our borrowers, maturity and sales of our securities available for
sale, growth of our deposits, federal funds sold and other short-term investments, and the various capital resources discussed above.
Liquidity management involves the ability to meet the cash flow requirements of our customers. Our customers may be either borrowers with credit needs or depositors wanting to withdraw funds.
Our liquidity management involves periodic monitoring of our assets considered to be liquid and illiquid, and our funding sources considered to be core and non-core and short-term (less than 12 months) and long-term. We have established
parameters that monitor, among other items, our level of liquid assets to short-term liabilities, our level of non-core funding reliance and our level of available borrowing capacity. We maintain a diversified wholesale funding structure and
actively manage our maturing wholesale sources to reduce the risk to liquidity shortages. We have also developed a contingency funding plan to stress test our liquidity requirements arising from certain events that may trigger liquidity
shortages, such as rapid loan growth in excess of normal growth levels or the loss of deposits and other funding sources under extreme circumstances.
We maintain a non-core funding dependency ratio below our peer group average and have had no brokered deposits on our balance sheet since before December 2012. At December 31, 2021, the Bank
held $1.13 billion of federal funds sold and other short-term investments as well as $411.2 million of unpledged securities available for sale. In addition, the Bank’s available borrowing capacity from correspondent banks was approximately
$225.4 million as of December 31, 2021.
In the normal course of business, we enter into certain contractual obligations, including obligations which are considered in our overall liquidity management.
In addition to normal loan funding, we also maintain liquidity to meet customer financing needs through unused lines of credit, unfunded loan commitments and standby letters of credit. The
level and fluctuation of these commitments is also considered in our overall liquidity management. At December 31, 2021, we had a total of $677.9 million in unused lines of credit, $128.6 million in unfunded loan commitments and $10.1 million in
standby letters of credit.
Liquidity of Holding Company: The
primary sources of liquidity for the Company are dividends from the Bank, existing cash resources and the capital markets if the need to raise additional capital arises. Banking regulations and the laws of the State of Michigan in which our
Bank is chartered limit the amount of dividends the Bank may declare and pay to the Company in any calendar year. Under the state law limitations, the Bank is restricted from paying dividends to the Company in excess of retained earnings. In
2020, the Bank paid dividends to the Company totaling $11.7 million. In the same period, the Company paid dividends to its shareholders totaling $10.9 million. In 2021, the Bank paid dividends to the Company totaling $33.1 million. In the
same period, the Company paid dividends to its shareholders totaling $10.9 million. The Company retained the remaining balance in each period for general corporate purposes. At December 31, 2021, the Bank had a retained earnings balance of
$83.1 million.
During 2021 and 2020, the Company received payments from the Bank totaling $8.0 million and $5.8 million, respectively, representing the Bank’s intercompany tax liability for the 2021 and 2020
tax years, respectively, in accordance with the Company’s tax allocation agreement.
The Company’s cash balance at December 31, 2021 was $7.8 million. The Company believes that it has sufficient liquidity to meet its cash flow obligations.
CRITICAL ACCOUNTING POLICIES AND ESTIMATES:
To prepare financial statements in conformity with accounting principles generally accepted in the United States of America, management makes estimates and assumptions based on available
information. These estimates and assumptions affect the amounts reported in the financial statements and future results could differ. The allowance for loan losses, other real estate owned valuation, loss contingencies and income taxes are
deemed critical due to the required level of management judgment and the use of estimates, making them particularly subject to change.
Our methodology for determining the allowance for loan losses and the related provision for loan losses is described above in the "Allowance for Loan Losses" discussion. This area of
accounting requires significant judgment due to the number of factors which can influence the collectability of a loan. Unanticipated changes in these factors could significantly change the level of the allowance for loan losses and the related
provision for loan losses. Although, based upon our internal analysis, and in our judgment, we believe that we have provided an adequate allowance for loan losses, there can be no assurance that our analysis has properly identified all of the
probable losses in our loan portfolio. As a result, we could record future provisions for loan losses that may be significantly different than the levels that we recorded in 2021.
Assets acquired through or instead of foreclosure, primarily other real estate owned, are initially recorded at fair value less estimated costs to sell when acquired, establishing a new cost
basis. New real estate appraisals are generally obtained at the time of foreclosure and are used to establish fair value. If fair value declines, a valuation allowance is recorded through expense. Estimating the initial and ongoing fair value
of these properties involves a number of factors and judgments including holding time, costs to complete, holding costs, discount rate, absorption and other factors.
Loss contingencies are recorded as liabilities when the likelihood of loss is probable and an amount or range of loss can be reasonably estimated. This, too, is an accounting area that
involves significant judgment. Although, based upon our judgment, internal analysis, and consultations with legal counsel we believe that we have properly accounted for loss contingencies, future changes in the status of such contingencies could
result in a significant change in the level of contingent liabilities and a related impact to operating earnings.
Our accounting for income taxes involves the valuation of deferred tax assets and liabilities primarily associated with differences in the timing of the recognition of revenues and expenses for
financial reporting and tax purposes. At December 31, 2021, we had gross deferred tax assets of $4.1 million and gross deferred tax liabilities of $1.9 million resulting in a net deferred tax asset of $2.2 million. Accounting standards require
that companies assess whether a valuation allowance should be established against their deferred tax assets based on the consideration of all available evidence using a "more likely than not" standard. With the positive results in 2021 and
positive future projections, we concluded at December 31, 2021 that no valuation allowance on our net deferred tax asset was required. Changes in tax laws, changes in tax rates, changes in ownership and our future level of earnings can impact
the ultimate realization of our net deferred tax asset.
| Item 7A. |
Quantitative and Qualitative Disclosures About Market Risk.
|
Our primary market risk exposure is interest rate risk and, to a lesser extent, liquidity risk. All of our transactions are denominated in U.S. dollars with no specific foreign exchange
exposure. Macatawa Bank has only limited agricultural-related loan assets, and therefore has no significant exposure to changes in commodity prices.
Our balance sheet has sensitivity, in various categories of assets and liabilities, to changes in prevailing rates in the U.S. for the federal funds rate, prime rate, mortgage rates, U.S.
Treasury rates and various money market indexes. Our asset/liability management process aids us in providing liquidity while maintaining a balance between interest earning assets and interest bearing liabilities.
We utilize a simulation model as our primary tool to assess the direction and magnitude of variations in net interest income and the economic value of equity (“EVE”) resulting from potential
changes in market interest rates. Key assumptions in the model include contractual cash flows and maturities of interest-sensitive assets and interest-sensitive liabilities, prepayment speeds on certain assets, and changes in market conditions
impacting loan and deposit pricing. We also include pricing floors on discretionary priced liability products which limit how low various checking and savings products could go under declining interest rates. These floors reflect our pricing
philosophy in response to changing interest rates.
We forecast the next twelve months of net interest income under an assumed environment of gradual changes in market interest rates under various scenarios. The resulting change in net interest
income is an indication of the sensitivity of our earnings to directional changes in market interest rates. The simulation also measures the change in EVE, or the net present value of our assets and liabilities, under an immediate shift, or
shock, in interest rates under various scenarios, as calculated by discounting the estimated future cash flows using market-based discount rates.
The following table shows the impact of changes in interest rates on net interest income over the next twelve months and EVE based on our balance sheet as of December 31, 2021 (dollars in
thousands).
|
Interest Rate Scenario
|
Economic
Value of
Equity
|
Percent
Change
|
Net Interest
Income
|
Percent
Change
|
||||||||||||
|
Interest rates up 200 basis points
|
$
|
325,982
|
2.35
|
%
|
$
|
53,933
|
15.89
|
%
|
||||||||
|
Interest rates up 100 basis points
|
324,004
|
1.73
|
50,076
|
7.60
|
||||||||||||
|
No change
|
318,498
|
—
|
46,539
|
—
|
||||||||||||
|
Interest rates down 100 basis points
|
287,371
|
(9.77
|
)
|
45,681
|
(1.84
|
)
|
||||||||||
|
Interest rates down 200 basis points
|
287,519
|
(9.73
|
)
|
45,339
|
(2.58
|
)
|
||||||||||
If interest rates were to increase, this analysis suggests that we are positioned for an increase in net interest income over the next twelve months. If interest rates were to decrease, this
analysis suggests that we are positioned for an increase in net interest income over the next twelve months.
We also forecast the impact of immediate and parallel interest rate shocks on net interest income under various scenarios to measure the sensitivity of our earnings under extreme conditions.
The quarterly simulation analysis is monitored against acceptable interest rate risk parameters by the Asset/Liability Committee and reported to the Board of Directors.
In addition to changes in interest rates, the level of future net interest income is also dependent on a number of other variables, including: the growth, composition and absolute levels of
loans, deposits, and other earning assets and interest-bearing liabilities; economic and competitive conditions; potential changes in lending, investing and deposit gathering strategies; and client preferences.